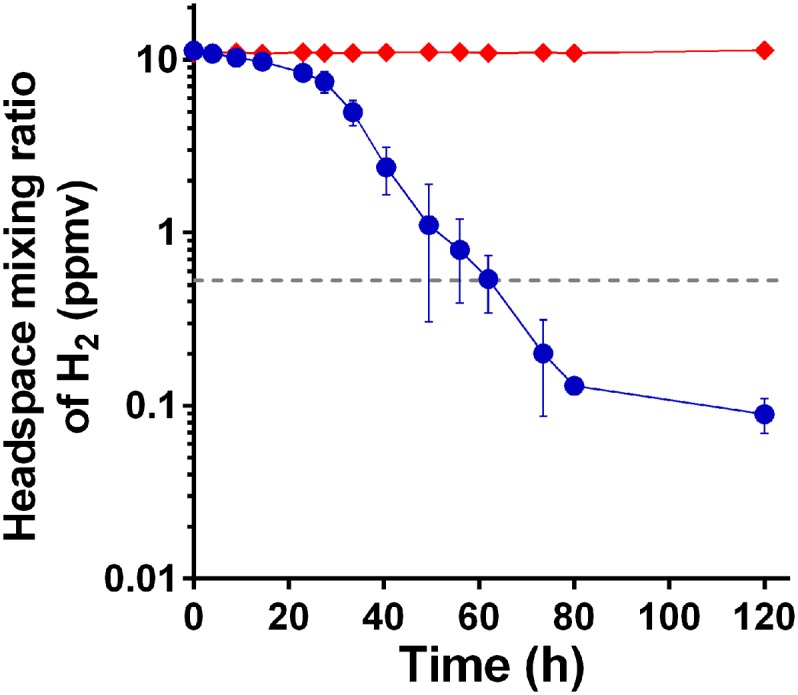
Fig. 4.

H2 uptake in carbon-limited stationary-phase cultures of P. methylaliphatogenes strain K22T. The depletion of a headspace of H2 was measured as a function of time in cultures inoculated with the bacterium (blue circles) against no-culture controls (red triangles). Mixing ratios are displayed on a logarithmic scale. Error bars represent SDs from three biological replicates. The gray dotted line shows the global mixing ratio of H2 in the lower atmosphere (0.53 ppmv).
