Fig. 3.
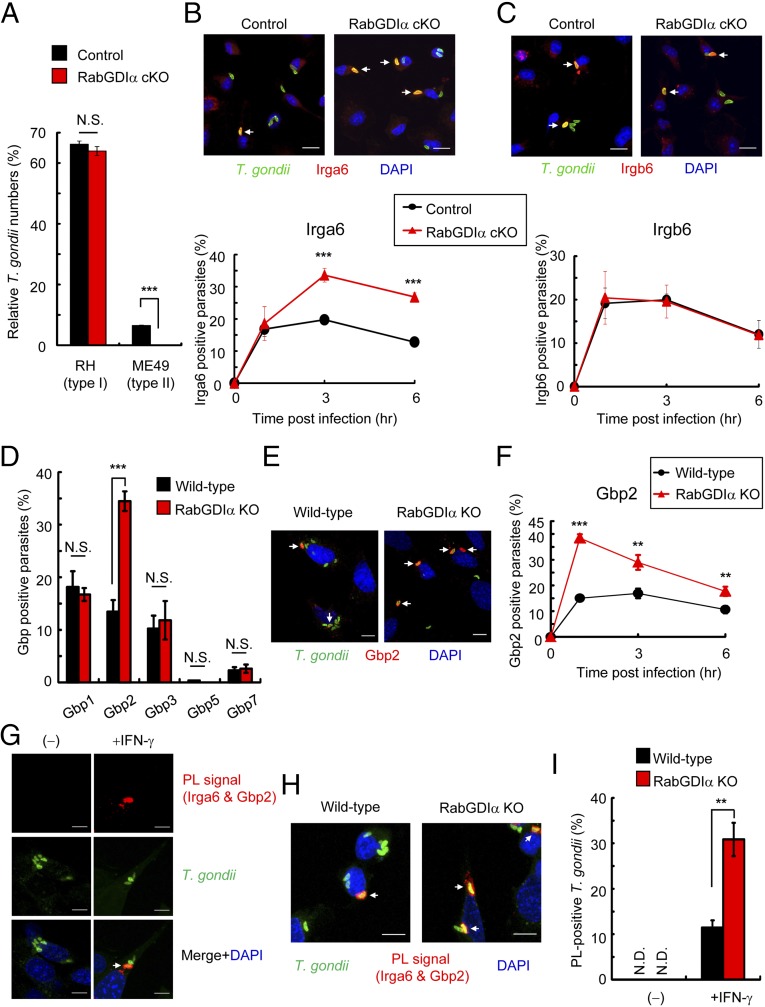
Increased accumulation of Irga6 and Gbp2 in RabGDIα-deficient cells. (A) Control and RabGDIα cKO macrophages were untreated or treated with IFN-γ. Untreated or IFN-γ–treated cells were infected with RH (type I) or ME49 (type II) T. gondii expressing luciferase (moi = 0.5) and harvested at 36 h postinfection. Percentages of parasite numbers (calculated by luciferase counts) in IFN-γ–stimulated control or RabGDIα-deficient cells relative to those in the unstimulated respective cells are shown as “Relative T. gondii numbers.” Indicated values are means ± SD of triplicates. (B and C) IFN-γ–stimulated control and RabGDIα-deficient macrophages were infected with ME49 T. gondii (moi = 0.5), fixed at 3 h postinfection, and incubated with rabbit anti-T. gondii (green) and mouse anti-Irga6 (red in B) or goat anti-Irgb6 (red in C). (Scale bars: 10 μm.) Arrows indicate colocalization of Irga6 or Irgb6 with T. gondii (Upper). The percentage of parasites positive for Irga6 or Irgb6 staining at the indicated points postinfection in IFN-γ–stimulated control and RabGDIα-deficient macrophages (Lower). Indicated values are means ± SD of triplicates. (D) The percentage of WT or RabGDIα-deficient MEFs positive for indicated Gbps staining at 1 h postinfection. Indicated values are means ± SD of triplicates. (E) IFN-γ–stimulated WT or RabGDIα-deficient MEFs were infected with T. gondii (moi = 4), fixed at 1 h postinfection, and incubated with rabbit anti-Gbp2 (red), and goat anti-T. gondii (green). (Scale bars: 10 μm.) Arrows indicate colocalization of endogenous Gbp2 with T. gondii. (F) The percentage of WT or RabGDIα-deficient MEFs positive for endogenous Gbp2 costaining with T. gondii at the indicated time points postinfection. Indicated values are means ± SD of triplicates. (G and H) Proximity-ligation (PL) assay of both endogenous Irga6 and Gbp2 in IFN-γ–stimulated or unstimulated (G), and WT or RabGDIα-deficient (H) MEFs. Cells were treated with IFN-γ, infected with ME49 T. gondii (moi = 4), and fixed at 3 h postinfection: [red, PL-positive (PL+) signals; green, T. gondii; blue, nuclei]. Arrows indicate colocalization of PL signal with T. gondii. (I) The percentage of parasites positive for PL signals (in H) at 3 h postinfection. Indicated values are means ± SD of triplicates. N.D., not detected; N.S., not significant; **P < 0.01, ***P < 0.001. Data are representative of two (A, B, Upper, C, Upper, D, E, G, and H) independent experiments. Data in B, Lower, C, Lower, D, F, and I are pooled from three independent experiments, in which almost 150 cells at each time point were counted.

