Fig. S4.
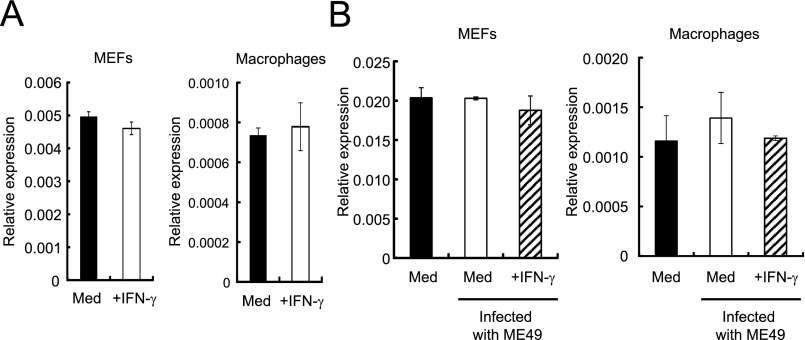
Unaltered expression of RabGDIα mRNA after IFN-γ stimulation and/or T. gondii infection. (A) MEFs or macrophages were untreated or treated with 10 ng/mL IFN-γ for 24 h. Relative mRNA levels of RabGDIα in untreated or IFN-γ–stimulated cells compared with the β-actin level are shown in the y axis. Indicated values are means ± SD of triplicates. (B) MEFs or macrophages were untreated or treated with 10 ng/mL IFN-γ for 24 h, and/or followed by the infection of the T. gondii ME49 (moi = 2). Relative mRNA levels of RabGDIα at 24 h postinfection compared with the β-actin level are shown in the y axis. Indicated values are means ± SD of triplicates. Data are representative of two independent experiments (A and B).

