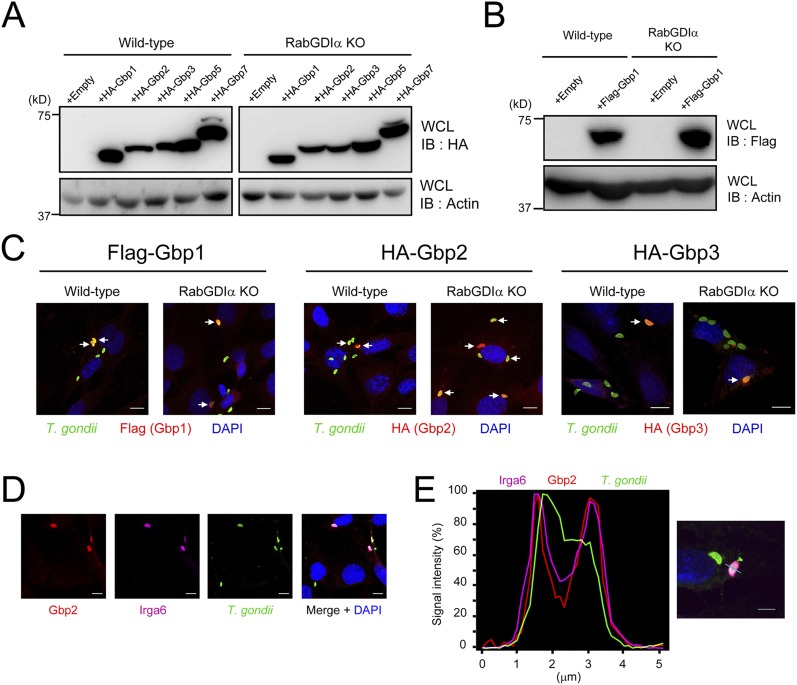
Fig. S8.
Stable expression of GBPs in MEFs and signal intensity profile of Gbp2 and Irga6 in IFN-γ–stimulated macrophages. (A and B) Lysates of MEFs stably transfected with empty or indicated HA-tagged Gbps (A) or Flag-tagged Gbp1 (B) expression vectors were subjected to Western blot using indicated Abs. (C) IFN-γ–stimulated WT or RabGDIα-deficient MEFs stably expressing indicated Gbps were infected with T. gondii (moi = 4), fixed at 1 h postinfection, and incubated with rabbit anti-T. gondii (green) and mouse anti-HA (for Gbp2 and Gbp3) (red) or mouse anti-Flag (for Gbp1) (red). (Scale bars: 10 μm.) Arrows indicate colocalization of Gbps with T. gondii. (D and E) MEFs treated with IFN-γ were infected with ME49 T. gondii (moi = 4), fixed at 3 h postinfection, and incubated with goat anti-T. gondii (green), rabbit anti-Gbp2 (red), or mouse anti-Irga6 (magenta). The samples were analyzed by confocal laser microscopy and subsequently by intensity profiling (E). (Scale bars: D, 10 μm; E, 5 μm.) The signal intensities of each color on the 5-μm light blue line on the parasites are shown. Data are representative of two independent experiments (A–E).

