Fig. 3.
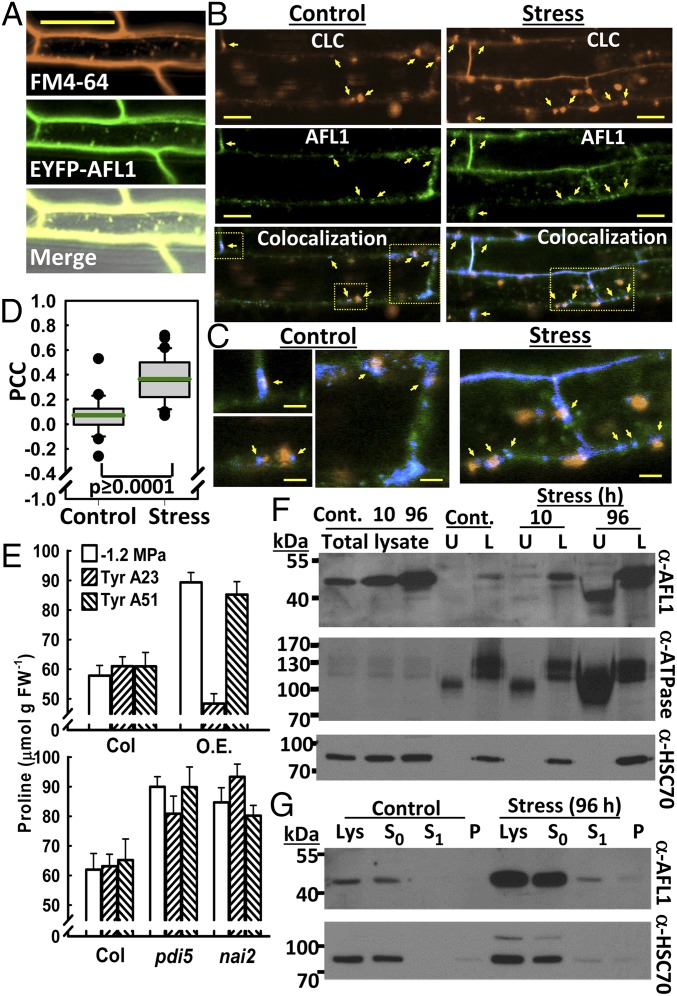
AFL1 colocalization with CLC and membrane association. (A) Colocalization of FM4-64 and YFP-AFL1. Images are from representative root cells of seedlings transferred to −0.7 MPa for 96 h. (Scale bar, 50 μm.) (B) Colocalization of YFP-AFL1 with CLC-mOrange. Images are from representative root cells of control seedlings or after transfer to −0.7 MPa for 24 h. Yellow arrows indicate points of AFL1–CLC colocalization at putative sites of vesicle formation or at the margins of vesicle-like particles along the PM. (Scale bars, 20 μm.) (Bottom) (Colocalization) Blue indicates pixels with signal from both fluorophores. Yellow boxes in the colocalization panels indicate regions that are enlarged in C. (C) Sections of the colocalization images in B enlarged to show sites of AFL1–CLC colocalization at the margins of vesicle-like particles or at sites indicative of the early stages of vesicle formation (marked by arrows). (Scale bars, 5 μm.) (D) Quantification of YFP-AFL1 and CLC-mOrange colocalization by PCC. Boxes contain the 25th–75th percentiles of data points; whiskers indicate the 10–90 percentiles; outliers are shown as dots. Green line indicates the mean. n = 24 (control) and 43 (stress). (E) Proline accumulation in seedlings treated with Tyrphostin A23 or its negative analog A51 and transferred to −1.2 MPa for 96 h. pdi5 and nai2 indicate the combined data of pdi5-1 and pdi5-2 or nai2-1 and nai2-3, respectively. O.E., AFL1 overexpression. Data are means ± SE (n = 12) from two to three independent experiments. (F) Aqueous two-phase partitioning of membranes from seedlings under control conditions (Cont.) or exposed to stress (−1.2 MPa) for 10 or 96 h. L, lower phase fraction enriched for endomembranes; U, upper phase fraction enriched for PM. H+ATPase is a PM marker (the lower molecular weight bands) and HSC70 is an ER marker. Ten micrograms of protein per lane were loaded. (G) Detection of AFL1 in supernatant and membrane pellet after low salt extraction, followed by wash with normal buffer. Lys, total lysate; P, membrane pellet collected at the same time as the S1 supernatant; S0, supernatant after initial pelleting of membranes in low salt buffer; S1, supernatant after wash with normal buffer. Forty micrograms of protein were loaded for each lane.

