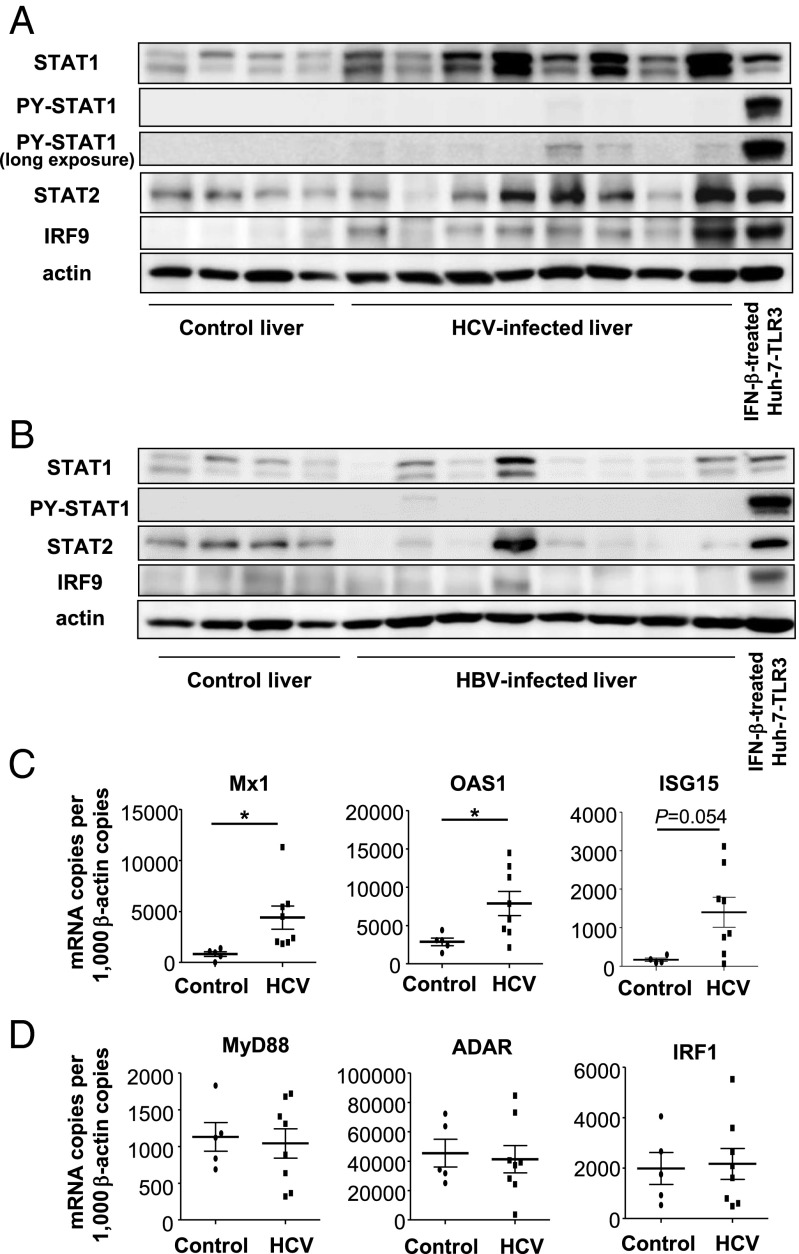
Fig. 1.
Expression of U-ISGF3 components and U-ISGs in livers of patients with chronic HCV infection. (A and B) Immunoblotting of STAT1, PY-STAT1, STAT2, and IRF9 was performed with control livers without viral hepatitis (n = 4) and HCV-infected livers (n = 8) (A) or HBV-infected livers (n = 8) (B). As a positive control for PY-STAT1, Huh-7–TLR3 cells were treated with IFN-β for 30 min. The Upper blot of PY-STAT1 was obtained after exposure for the same time as the blot of STAT1, and the Lower blot of PY-STAT1 was obtained after much longer exposure to detect the minimal amount of PY-STAT1. (C and D) The expression of U-ISGs (C) and ISGs known to be regulated only by ISGF3 (D) was examined by TaqMan real-time quantitative PCR in control livers without viral hepatitis (n = 5) and HCV-infected livers (n = 8). The data represent the means ± SD, *P < 0.05 compared with control.

