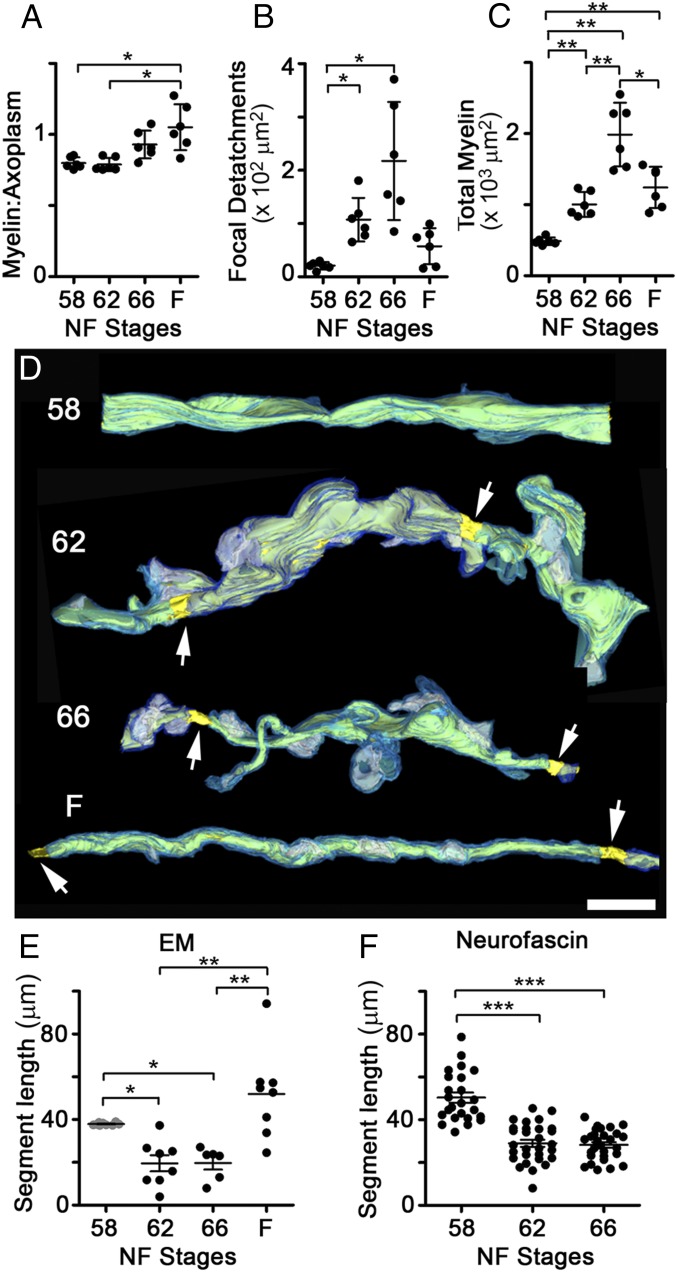
Fig. 2.
Myelin segment shortening involves an alteration of the myelin-axon relationship. (A) Mean ratio of myelin area over axoplasm area per axon, averaged per ON. (B) Total cross-sectional area of periaxonal spaces under focal myelin detachments, per ON. (C) Total area of myelin, per ON cross-section. (D) Reconstructions of axons at stages 58, 62, and 66 and in F, based on SBEM datasets datasets and shown over black backgrounds, with traced myelin (light and dark blue), axoplasm (yellow), focal periaxonal space enlargements (white), and nodes of Ranvier (arrows). (Scale bar: 5 μm.) (Additional axons are shown in Fig. S2D). (E) Internodal distances measured from SBEM-traced axons. Stage 58 values (gray) are minimum lengths because segments generally exceeded the volume dimensions (n = 10, 8, 6, and 8 segments at stages 58, 62, and 66 and in F, respectively). (F) Internodal distances (n = 23, 28, and 28 axons at stages 58, 62, and 66; n = 3 ONs per stage) measured in ON volumes immunolabeled with 3A10 and neurofascin. In A–C, measurements are from traced TEM micrographs (n = 6). Mean ± SD is shown. *P < 0.5; **P < 0.01; ***P < 0.001 [by the Games–Howell (A–C), Kruskal–Wallis (E), and Tukey’s (F) tests].

