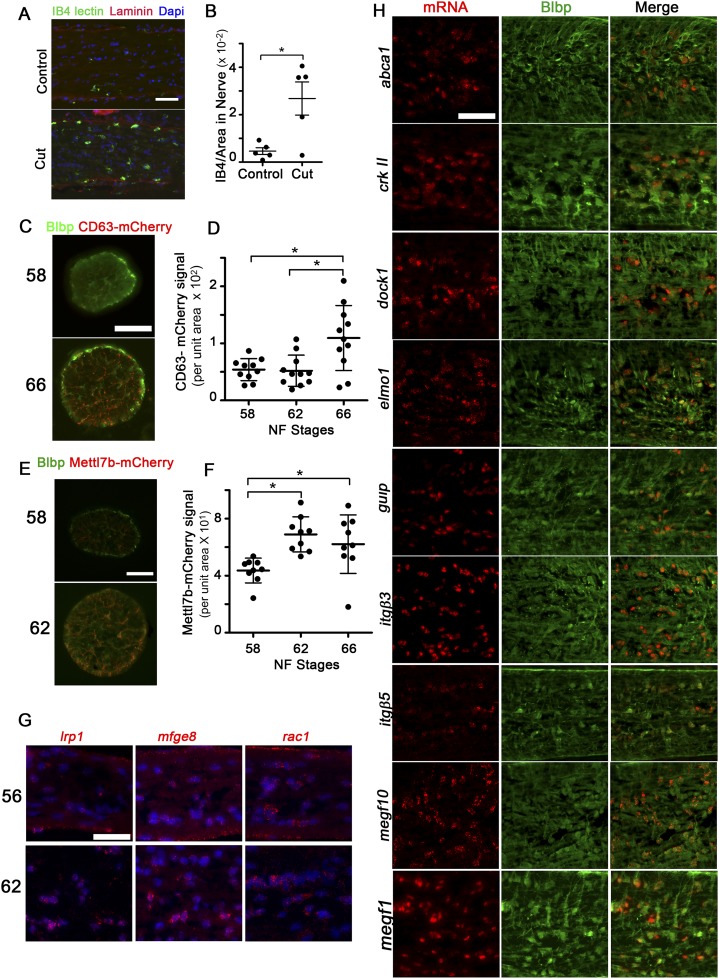
Fig. S4.
Astrocytes express phagocytic genes in the metamorphic ON. (A) IB4-lectin-FITC–labeled microglia (green), laminin-immunolabeled ON sheath (red), and DAPI-labeled nuclei labeled (blue) in ON longitudinal cryosections, showing that IB4-lectin+ microglia infiltrate the ON parenchyma in stage 60 animals 3 d after ON transection. (Scale bar: 50 μm.) (B) IB4-lectin-FITC signal per unit area in the ON core 3 d after ON transection, per ON (n = 5). *P < 0.05 by Tukey’s test. (C) Immunofluorescence due to Tg(Blbp:Cd63-mCherry) transgene (red) in ON cross-sections at stages 58 and 66 shows this lysosomal marker accumulating in processes of Blbp-immunolabeled astrocytes (green). (Scale bar: 50 μm.) (D) mCherry signal for Tg(Blbp:Cd63-mCherry) per unit area is elevated at stage 66. Measures show mean ± SD (n = 10 ON per stage). *P < 0.05 by the Games–Howell test. (E) Immunofluoresence due to Tg(Blbp:Mettl7b-mCherry) transgene (red), a lipid droplet marker, accumulates in processes of Blbp-immunolabeled astrocytes (green) during metamorphic climax. (Scale bar: 50 μm.) (F) mCherry signal, derived from the Tg(Blbp:Mettl7b-mCherry) transgene, per unit area is elevated during metamorphic climax. Measurement shows mean ± SD (n = 10 ON per stage). *P < 0.05 by Tukey’s test. (G) ON longitudinal cryosections at both stages 56 and 62 show expression for phagocytic genes (red) lrp1, mfge8, and rac1. Nuclei are labeled with DAPI (blue). (Scale bar: 50 μm.) (H) ON longitudinal cryosections show that astrocytes, immunolabeled with Blbp (green), express the mRNAs (red) for phagocytic genes, including abca1, crkII, dock1, elmo1, gulp, itgβ3, itgβ5, megf10, and megf11, as shown at stage 62. (Scale bar: 50 μm.) Note that there are some Blbp-negative cells, of unknown identity, that express high levels of dock-1, itgβ3, and megf11.

