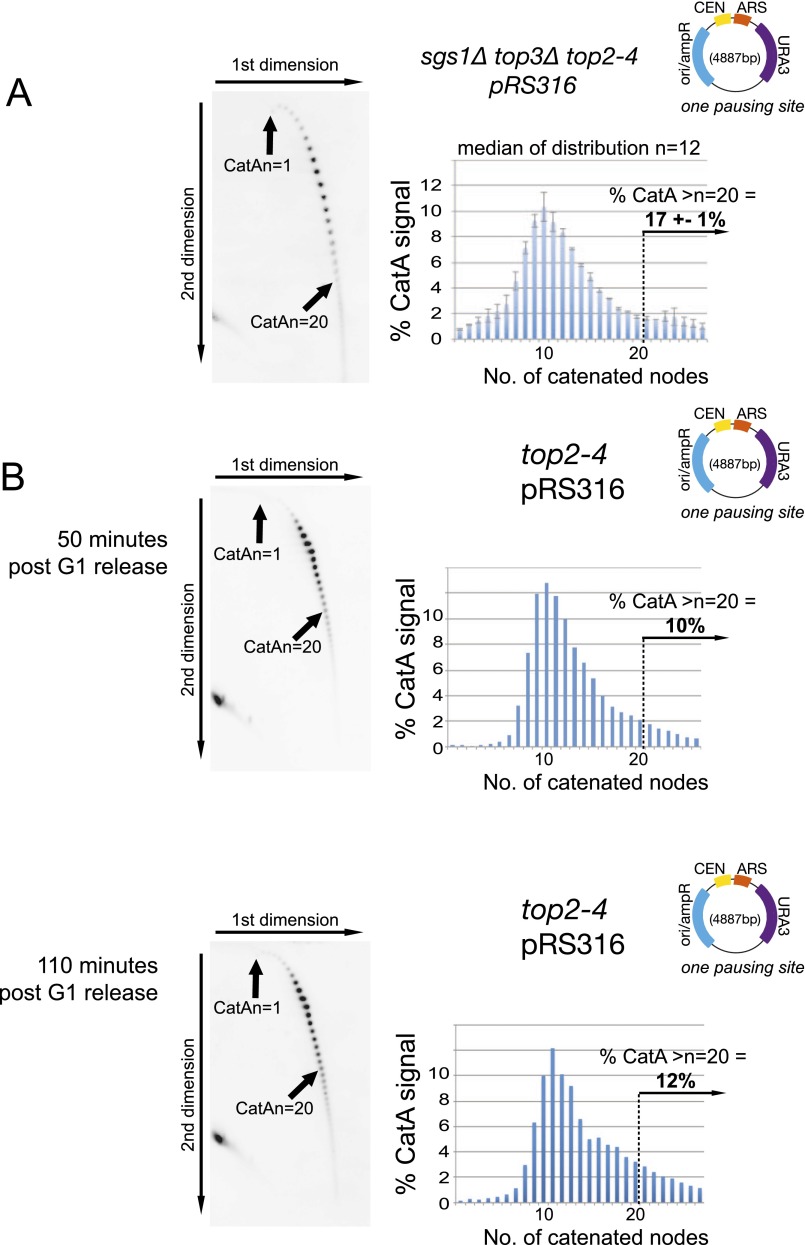
Fig. S3.
Quantification of DNA catenation is directly related to incidence of fork rotation on plasmids. (A) Deletion of TOP3 does not alter the level of DNA catenation generated in catenated plasmids. DNA catenation analysis of plasmid pRS316 in sgs1Δ top3Δ top2-4 cells was analyzed as in Fig. 1. SGS1 is deleted in this strain to allow relatively normal levels of proliferation of the cells. Histograms and % of plasmids with >20 catenanes represent the average of two independent experiments. Error bars or values are equal to the average deviation of the experiments. (B) No residual decatenation activity can be detected in top2-4 cells maintained under restrictive conditions. DNA catenation analysis of plasmid pRS316 in top2-4 cells isolated either 50 or 110 min after release from alpha factor arrest. DNA was analyzed as described in Fig. 1.

