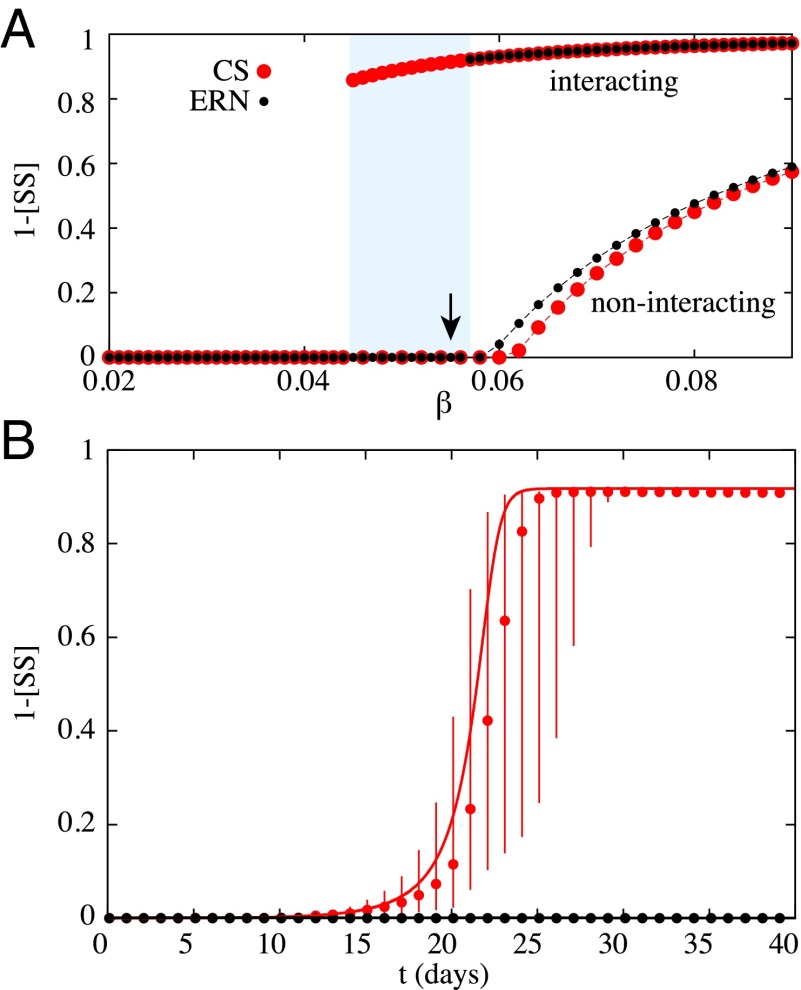
Fig. 4.
First-order phase transition and epidemic latent heat. (A) Emergence of an endemic steady state for a scenario where equivalent diseases are either noninteracting () or interacting ( on the community structure (again, cliques of size 10) and its equivalent random network. Their transmission rates are given as a fraction of the recovery rate . The shaded region highlights a parameter region where interacting diseases on CS networks can spread explosively, whereas they cannot on the ERN. (B) Time evolution of the interacting diseases at the value (indicated with an arrow in A). The markers give the median state of the Monte Carlo simulations with error bars corresponding to the 75% interval, whereas the curves give the prediction of our mean-field formalism. Note that the epidemics die out on the ERN and not on the CS, despite the heavy stochasticity caused by the nearby discontinuity (as seen in A).

