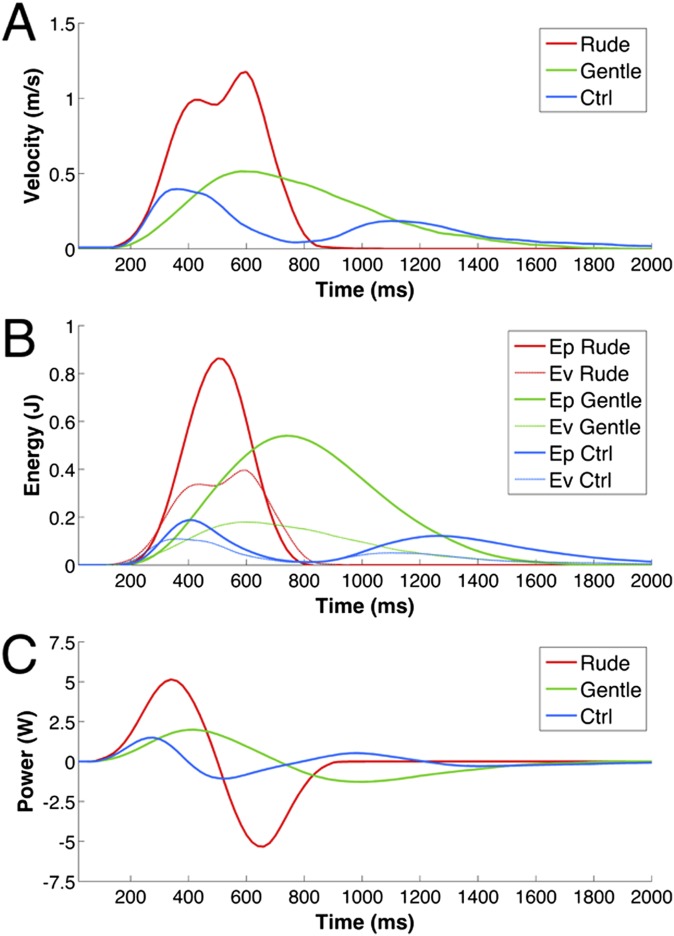
Fig. S1.
Kinematic and dynamic average profiles of the actions performed by the actor with different objects (vitality: ball, cup, bottle, and crackers; Ctrl: small ball). (A) Graph depicts the velocity profiles and duration of the hand performing the action (blue, Ctrl; green, Gentle; red, Rude). (B) Graph depicts the potential (Ep) and kinetic (Ev) energies. (C) Graph depicts the power required to perform the action on the objects.

