
Figure 4.
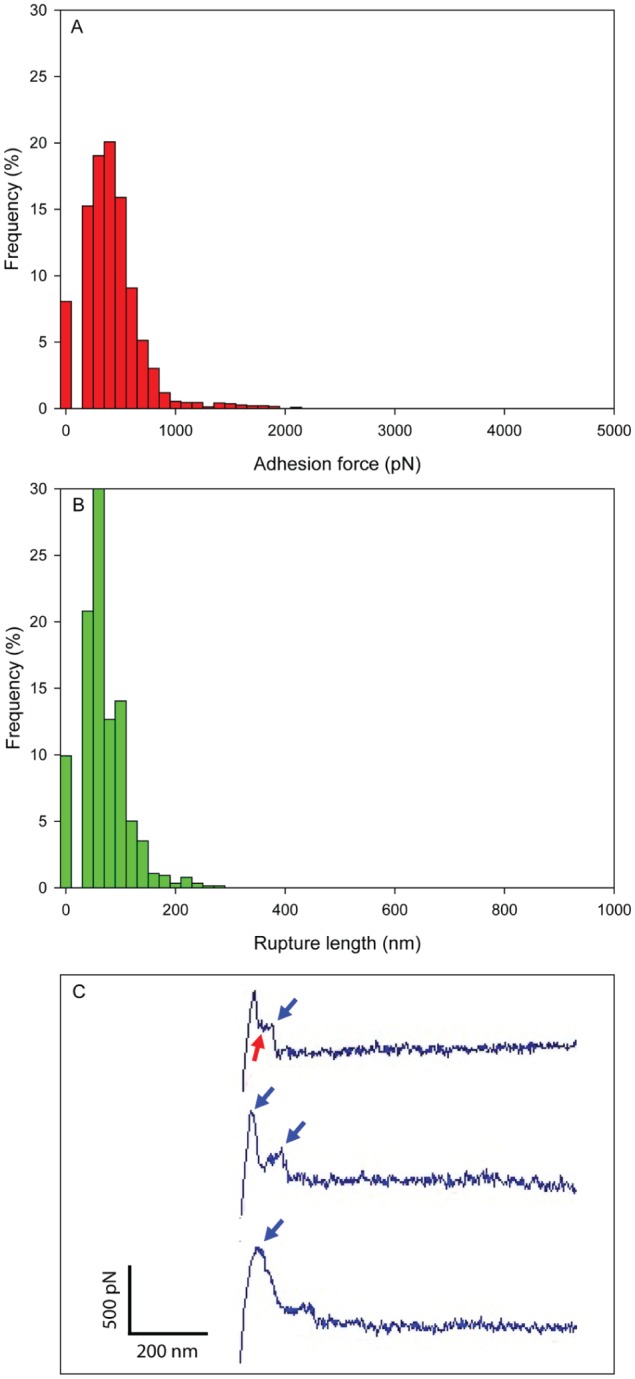
Binding force and rupture length of glucosyltransferase B (GtfB) on Streptococcus mutans surfaces. (A) Adhesion force histogram, (B) rupture length histogram, and (C) representative retraction force curves. Blue arrows indicate force plateau, while red arrows indicate sawtooth pattern of force curves. The maximum adhesion force and the rupture length from last peak were used to generate the histograms. This figure is available in color online at http://jdr.sagepub.com.