
Figure 7.
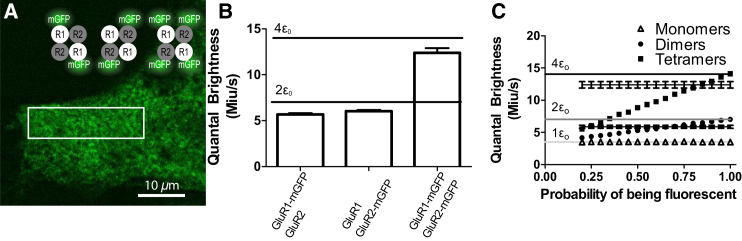
SpIDA analysis of tetrameric glutamate receptor (GluR). (A) A subregion of an image of a cell transfected with GFP-R1 and GFP-R2 plasmids. The image size is 1024 × 1024 pixels with pixel size of 0.092 μm. (Rectangle) A sample analyzed ROI. (B) Plot showing the mean fitted quantal brightness and the standard error for the three cases (GluR1-mGFP/GluR2 (N = 92), GluR1/GluR2-mGFP (N = 91), and GluR1-mGFP/GluR1-mGFP2 (N = 73)). For the case where R1-mGFP and R2-mGFP plasmids were transfected, the theoretical values for the quantal brightness of monomers, dimers, and tetramers are shown (green). Error bars = mean ± SE. (C) Graph showing the mean quantal brightness for an oligomer in which some of the GFPs are not fluorescent. The quantal brightness recovered for samples containing respectively only monomers (triangles), dimers (circles), and tetramers (squares) as a function of the probability that each GFP is nonfluorescent are present. Twenty-five simulations of 50 × 250 pi2 with monomeric quantal brightness set to 20 iu and the e−2 convolution radius was set to 3 pixels. The error bars correspond to SD. One-population SpIDA fit (Eq. 1) was used to fit those simulated images. The recovered fitted values for dimers and tetramers found in (B) are also shown. (Rectangle) Overlap of the simulated and experimental distributions. From this graph, we found a probability of 67 ± 7% (for dimers) and 84 ± 5% (for tetramers) of having a fluorescent GFP. The theoretical values for the quantal brightness of monomers, dimers, and tetramers for perfect labeling are also presented. To see this figure in color, go online.