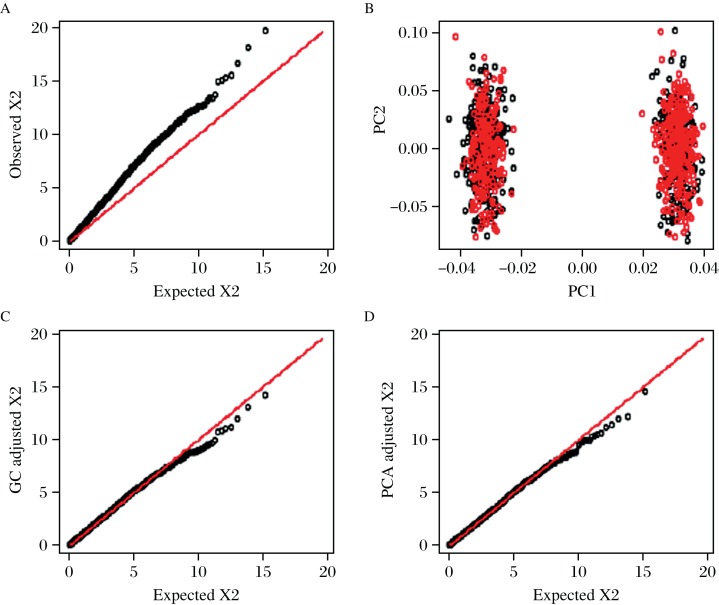
Fig. 2. The quantile-quantile plot and population structure adjusted by genomic control and principal components analysis.
A: The Q–Q plot of the original chi–squared test statistics generated using Cochran–Armitage trend test. Departure from the diagonal is observed, the estimated inflation factor is 1.389 (95%CI: 1.343–1.446). B: The first two principal components from EIGENSTRAT with different colors indicating cases and controls. The first PC well distinguishes the two subpopulations. C: The Q–Q plot of the adjusted chi–squared test statistics by genomic control, the resulting inflation factor is 1.000 (95%CI: 0.967–1.042). D: The Q–Q plot of the adjusted chi–squared test statistics by the first principal component, the resulting inflation factor is 0.973 (95%CI: 0.940–1.020).

