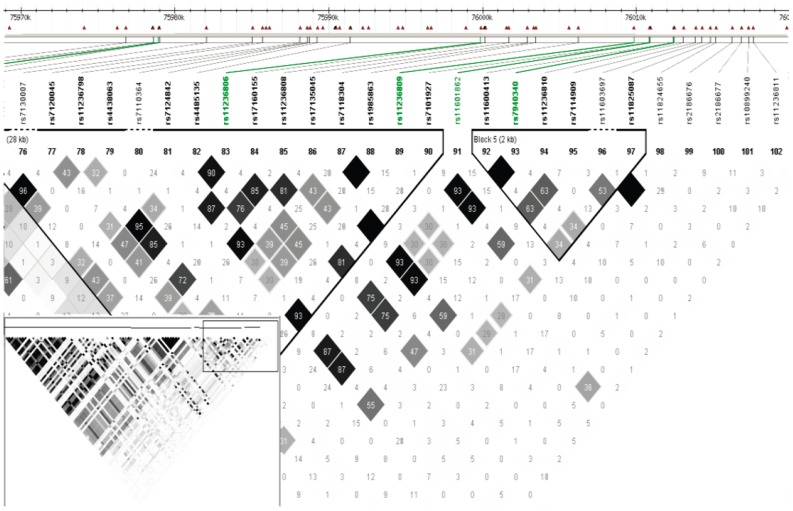
Fig. 4. Linkage disequilibrium structure of the selected SNPs.
The grey scale indicates the strength of correlation coefficient r2 between two SNPs; the black lines indicate the block structure of the human genome. The white bars at the top indicate the position of SNP, each square represents the correlation of two SNPs measured by the correlation coefficient r2 between the alleles of the two SNPs, and the shades of grey indicate the strength of the correlation varying from zero correlation (white) to strong correlation (black).

