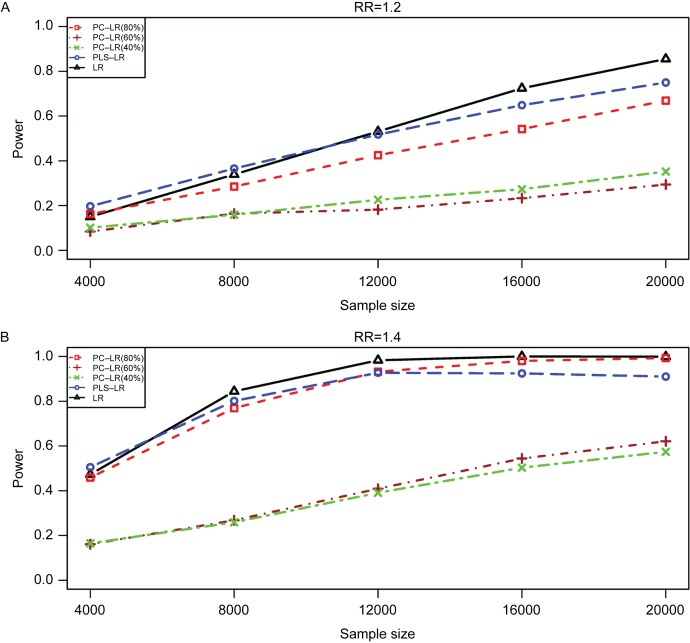
Fig. 2. The powers of principal component-based logistic regression (PC-LR), PLS logistic regression (PLS-LR) and single-locus logistic regression (LR) under different sample sizes at the given relative risk of 1.2 and 1.4 with the 7th SNP (rs6554759, MAF: 0.053) on CLPTM1L gene as the causal variant.
The horizontal axis (x-axis) denotes the sample sizes and the vertical axis (y-axis) denotes the powers of PC-LR (80%), PC-LR (60%), PC-LR (40%), PLS-LR and LR. Figure (A) and (B) depict the results obtained with the RR of 1.2 and 1.4, respectively.

