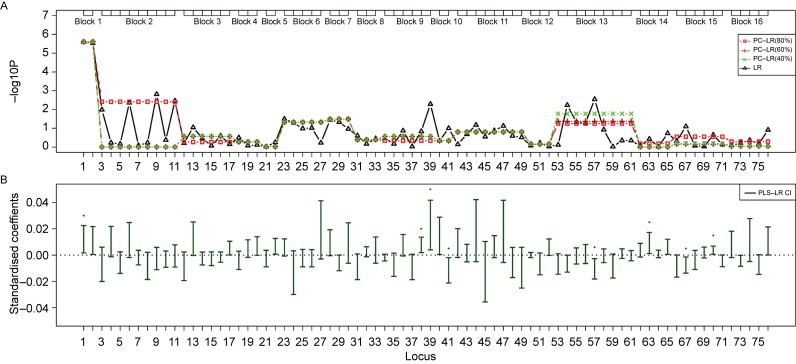
Fig. 6. The SNP sets based analysis results of principal component-based logistic regression (PC-LR), PLS logistic regression (PLS-LR) and single-locus logistic regression (LR) on the TP63 gene region from a non-small cell lung cancer GWAS.
The top plot (A) shows the p-values in −log10 (p-value) scale (y-axis) of single-locus LR and SNP sets based PC-LR over the locations (x-axis) of 76 SNPs. The haplotype block-based SNPs sets are showed as boxes on the top. For PC-LR method, p-values of all SNPs in the same SNPs set are all denoted by the same p-value of the SNPs set. The bottom plot (B) shows the PLS-LR confidence intervals of standardized coefficients (y-axis) over the locations (x-axis) of 76 SNPs. ★: significant at the level of 1E-6.

