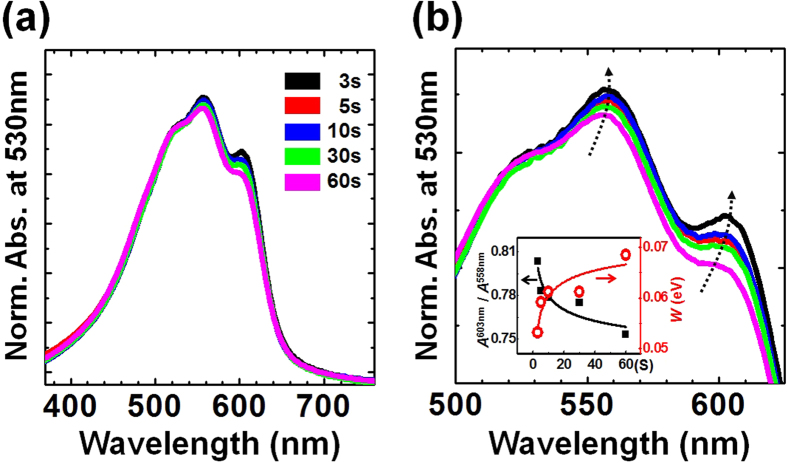
Figure 1. UV-Vis absorption spectral analysis.
(a) UV-Vis absorption spectra showing the normalized absorption bands at the 0–2 transition (λ = 530 nm) in the P3HT thin films spin-cast for various spinning times. (b) Magnified view of the normalized UV-Vis absorption bands. The spinning time applied during the spin-coating process decreased along the direction of the arrow. The inset shows the intensity ratio between the first (λ = 603 nm) and second (λ = 558 nm) vibronic transitions and the interchain coupling energy W as a function of the spinning time.

