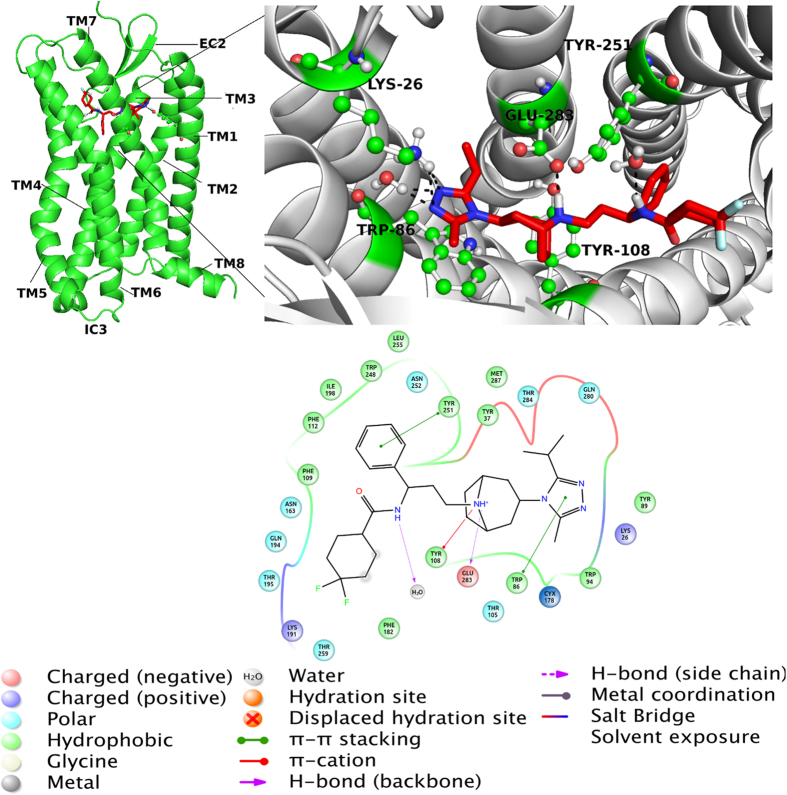
Figure 6.
(left) Representative complex from 30000 derived frames after MD simulations has been shown. (right) 3D ligand interaction diagram show key interactions at the binding site. (bottom) 2D ligand interaction diagram represents types of interactions (amino acid residues within 4 Å are considered). Details of interactions are included.

