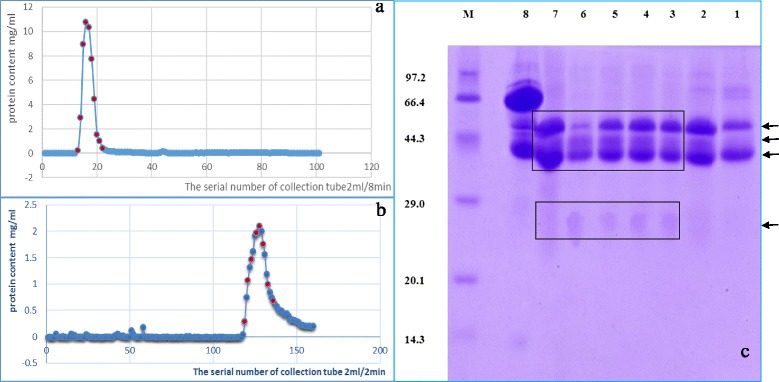
Fig. 2.

a sephadex G-200 column elution curves, there are only single peak from the 13th to the 22th collection tubes which were marked red dot. b DEAE-52 ion exchange column elution curves, the gradient elution with phosphate buffer (0.01–0.3 mol/L, pH 8.0), there are only single peak. c SDS-PAGE results: lanes 1–7 are respectively the 136th, 133th, 130th, 128th, 126th, 123th, 121th collection tube which were marked red dot in (b). the 8th lane is the concentrations of 13–22 collection tubes in (a). M lane is the protein marker. The molecular weight of IgG1, IgG2 and IgG3 was 164.6, 94.7 and 89.4 kDa respectively
