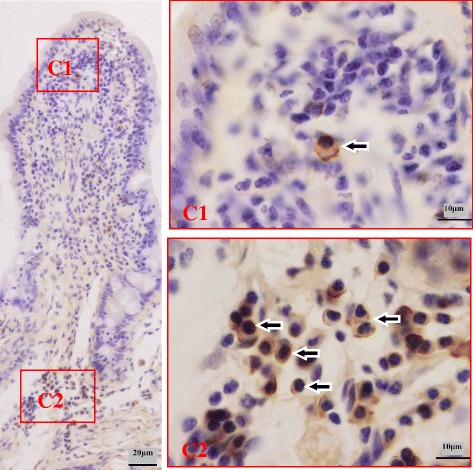
Fig. 5.

Distribution pattern of IgG ASCs in the ileum. The left large picture presents an overview of a typical Bactrian camel ileum structure with sublocalizations C1-C2 in frames. Small pictures C1-C2 illustrate representative views from the two sublocalizations. Cells labeled positively for IgG ASCs show brown staining (arrowhead)
