
. 2015 Jul-Aug;5(4):276–282. doi: 10.4103/2231-0762.161227
Copyright: © Journal of International Society of Preventive and Community Dentistry
This is an open access article distributed under the terms of the Creative Commons Attribution-NonCommercial-ShareAlike 3.0 License, which allows others to remix, tweak, and build upon the work non-commercially, as long as the author is credited and the new creations are licensed under the identical terms.
Graph 1.
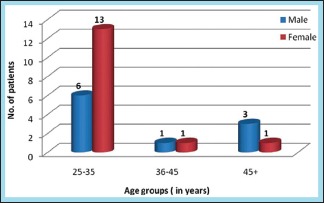
Distribution of study subjects according to age and gender