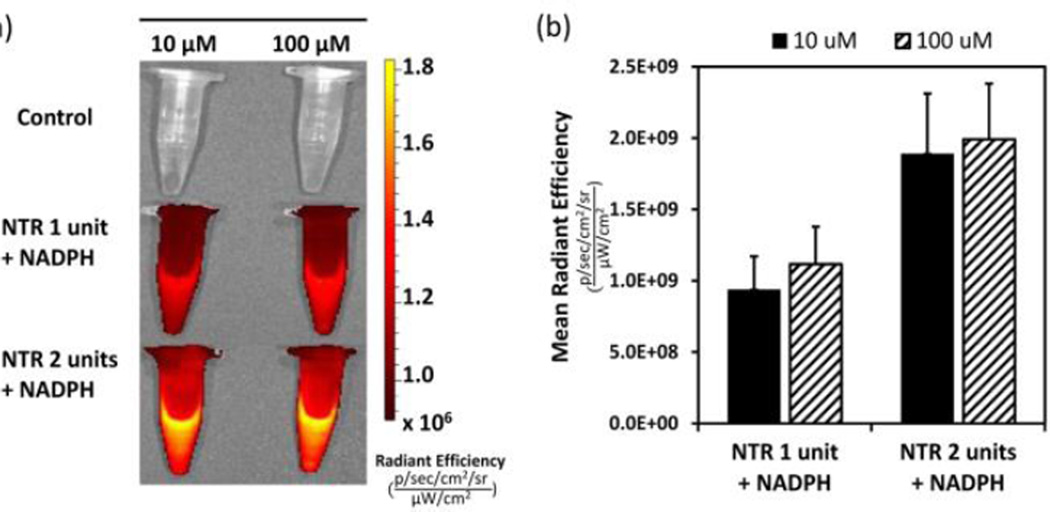
Fig. 3.
Fluorescence response of p-NBMB to nitroreductase. (a) IVIS fluorescence images of p-NBMB (10 μM, 100 μM) with nitroreductase (1 and 2 unit/ml, 1 mM NAD(P)H) and the control without nitroreductase. (b) Quantitation of fluorescence from each group. Data shown as mean ± SD (n = 3). Spectra were acquired after incubation at 37 °C overnight in 10 mM PBS (pH 7.4).

