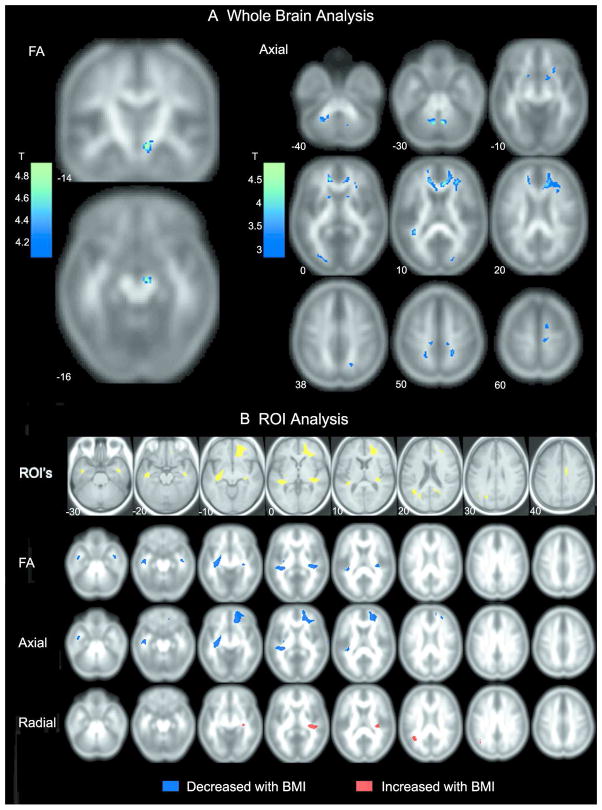
Figure 1.
A) Regions identified from the whole brain analysis showing significant negative correlations between BMI and FA (left side) and BMI and axial diffusion (right side). B) Results of the ROI analysis. Axial sections in the first row depict areas of increased white matter volume with increasing BMI identified previously in VBM analysis (4). Diffusion measures were extracted from these regions of interest. ROIs of significant correlations between BMI and FA, axial, and radial diffusion are shown in the following rows. Blue represents negative correlations with BMI and red represents a positive correlation with BMI.

