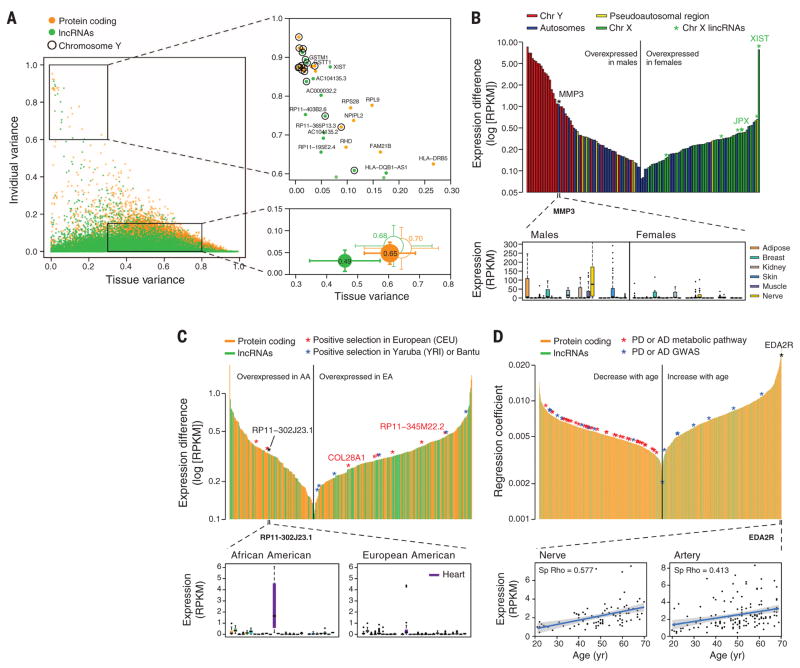
Fig. 2. Gene expression across tissues and individuals.
(A) Left: Contribution of tissue and individual to gene expression variation of PCGs and lncRNAs. Bottom right: Mean ± SD over all genes (filled circles) and over genes with similar expression levels in PCGs and lncRNAs (unfilled circles). Circle size is proportional to the sum of tissue and individual variation, and segment length corresponds to 0.5 SD. Top right: genes with high individual variation and low tissue variation. (B) Sex differentially expressed genes. Top: differentially expressed genes (FDR < 0.05) sorted according to expression differences between males and females. Genes in the Y chromosome are sorted according to the expression in males. Bottom: MMP3 gene expression in males and females. (C) Genes differentially expressed with ethnicity. Top: differentially expressed genes (FDR < 0.05) between African Americans (AA) and European Americans (EA) sorted according to expression differences. A few of these genes lie in regions reported to be under positive selection in similar populations. Bottom: expression of RP11-302J23.1. (D) Genes differentially expressed with age. Top: Genes sorted according to the regression coefficient. Bottom: expression of EDAR2 gene in nerve and artery as a function of age. Shaded area around the regression line represents 95% confidence interval.

