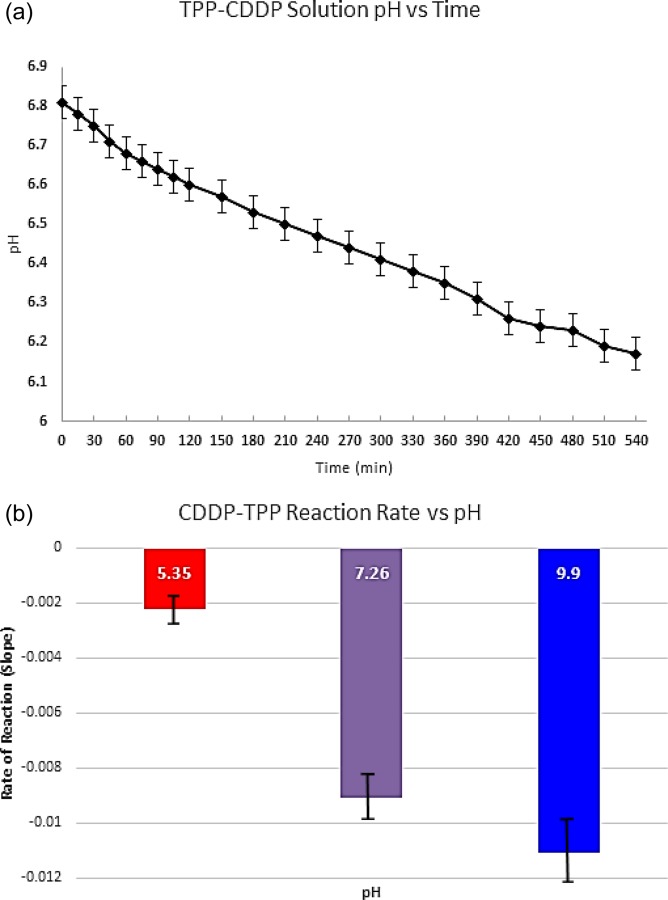
Fig. 5.

(a) pH of the CDDP-TPP solution measured at 15 mins intervals for the initial 2 hrs and at 30 mins intervals over the course of an additional 5 hrs and (b) rate of the hypothesized CDDP-TPP reaction. The rate was measured by plotting out the % decrease in pH over the first hour and analyzing the slopes of the lines for each condition. We believe that the greater pH depression rates can be correlated with a more rapid production of phosphoric acid.
