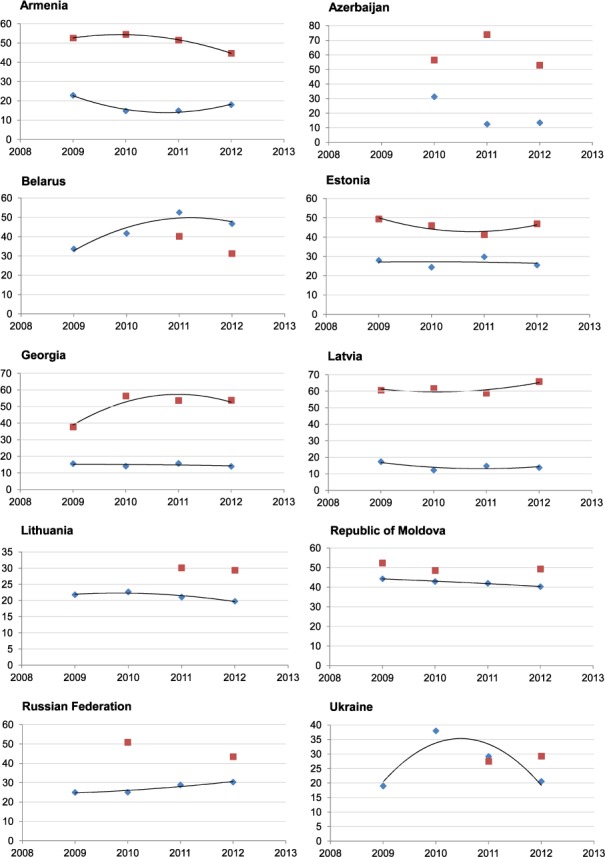
FIGURE 3.

Proportion of MDR-TB among all notified TB cases with first-line DST and treatment success rates in countries in Eastern Europe, 2009–2012. Note: Trend-line not drawn where fewer than 4 data points are available. x-axis = year; y-axis = proportion; ♦ = proportion of MDR-TB among all notified TB cases with first-line DST; ▪ = proportion of all notified MDR-TB cases with a successful treatment outcome for that year. MDR-TB = multidrug-resistant tuberculosis; DST = drug susceptibility testing.
