
Figure 3. Tracking cell metabolism.
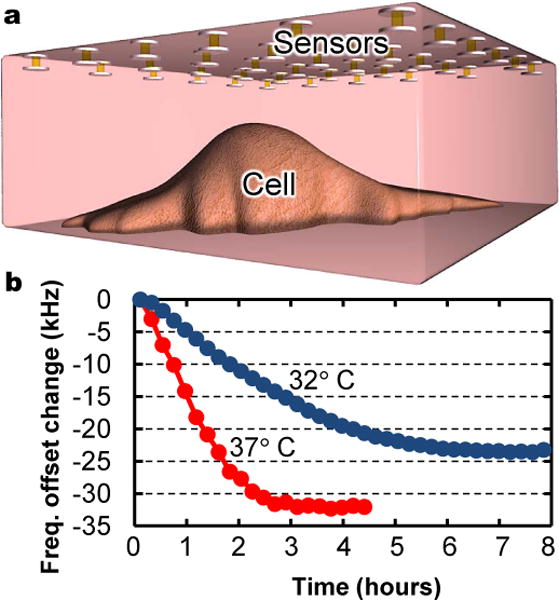
a, Schematic of experiment showing sensors suspended above MDCK cells in sealed volume of cell growth medium. b, Shifts in sensor resonance frequencies over time as cells acidify surrounding medium through metabolic CO2 production and cell necrosis. Different curve slopes and amplitudes confirm different metabolic rates and levels of acidification for experiments run at 37°C and at 32°C, with higher and lower cell densities, respectively.