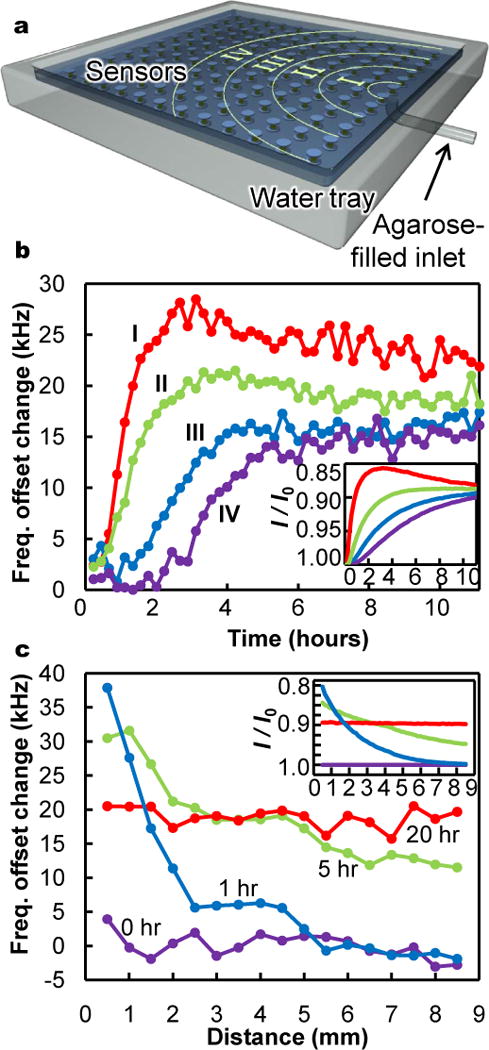
Figure 2. Spatiotemporal mapping of ion concentrations.

a, Schematic of array of sensors (not to scale) submerged in a water tray filled with a 0.1 M, pH 7.5 buffer that contacts one end of a short tube filled with water-based agarose gel. As ions diffuse from the buffer solution into the agarose, locally depleted ion concentrations within the buffer are detected through induced shifts in sensor resonances. With an agarose volume one tenth that of the buffer, complete mixing corresponds to a 10 millimolar ion reduction, but smaller transient dilutions are also resolvable. b, Time evolution of sensor readings in zones I, II, III, and IV, corresponding to distances from the agar inlet of approximately 1mm to 3mm, 3mm to 5mm, 5mm to 7mm, and 7mm to 9mm, respectively. c, Spatial variation in sensor readings as a function of distance from agarose at various time points. Insets in (b) and (c) show numerical simulations of expected spatiotemporal variations in ionic strength, I, normalized to initial ionic strength, I0.
