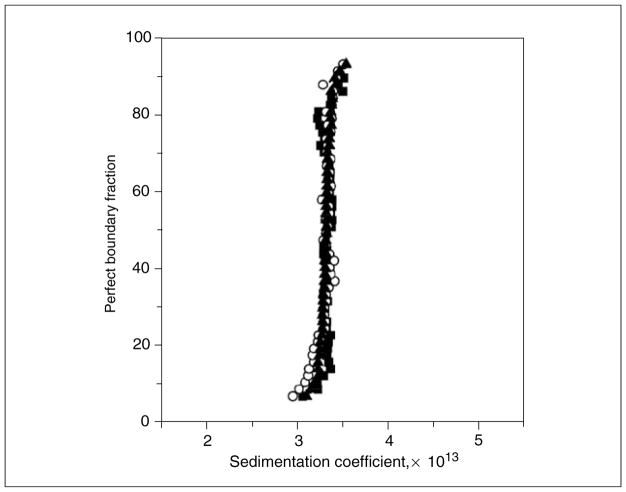
Figure 7.13.7.
van Holde-Weischet integral distribution plots for the ovalbumin sample shown in Figure 7.13.3, measured at three different loading concentrations. Filled squares represent 0.1 OD at 280 nm, open circles represent 0.3 OD at 280 nm, and filled triangles represent 0.9 OD at 280 nm. The vertical shape of the s-value distribution indicates homogeneity. Identical results for all three concentrations indicate absence of reversible self-association in this concentration range (in contrast to the data shown in Fig. 7.13.8).

