
Figure 7.13.9.
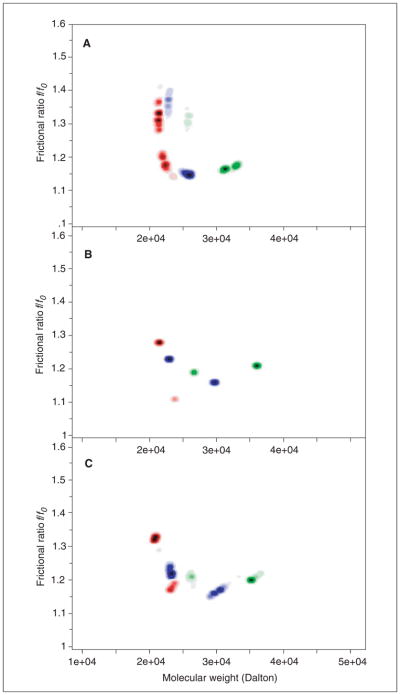
UltraScan composition analysis of the data shown in Figure 7.13.8 (Relative concentrations: red: 0.1, blue: 1.0, green: 10.0). Solute signal is indicated by darkness of color in the 2-dimensional molecular weight/shape plane. (A) Monte Carlo analysis of the 2-dimensional spectrum analysis. (B) Parsimonious regularization by genetic algorithm analysis. (C) Monte Carlo analysis of genetic algorithm analysis shown in (B). The shift to higher molecular weight with increasing concentration is clearly apparent in all three methods. The spreading of peaks is dependent on stochastic noise in the data and is proportional to the confidence intervals of the parameters. Note that a noninteracting analysis does not reproduce the solutes (monomer and dimer) exactly, due to interactions between the oligomeric species. This results in measurements of the weight-average sedimentation coefficient and the gradient-average diffusion coefficient present at each point in the moving boundary. In the extreme of a very slowly interacting system, kinetic effects are minimal and the oligomeric species can be resolved reliably (Brookes et al., 2009). For the color version of this figure go to http://www.currentprotocols.com/protocol/ps0713.