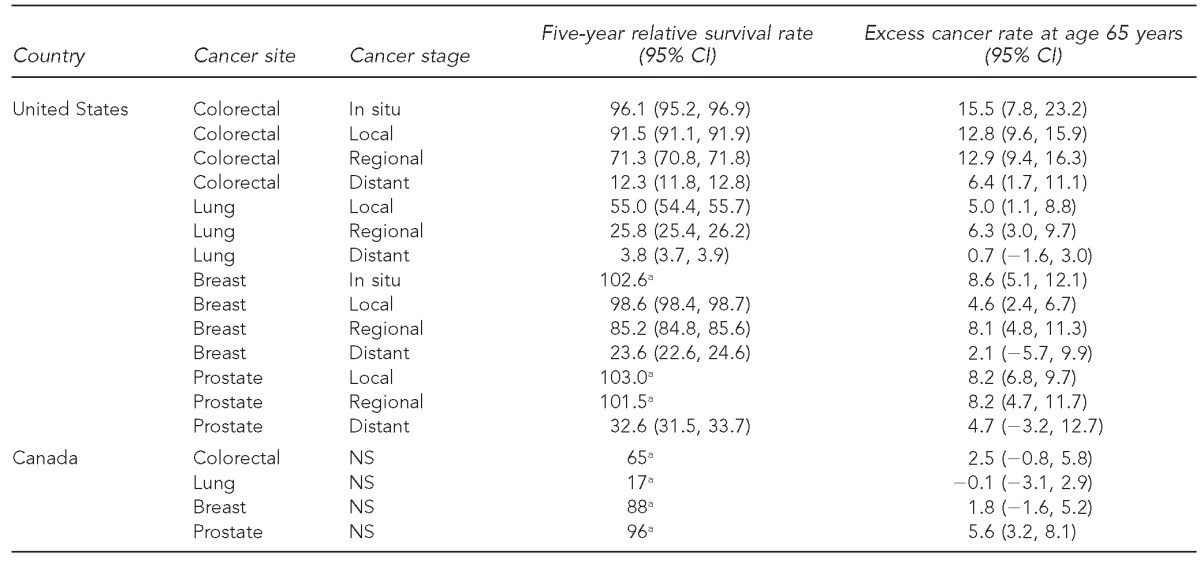
Table.
Five-year cause-specific survival and above-expected cancer rates at age 65 years, United States and Canada, 2000–2010

aSEER*Stat software does not define CIs for relative survival exceeding 100%. Additionally, Canadian survival data were published without CIs.
CI = confidence interval
NS = not specified
