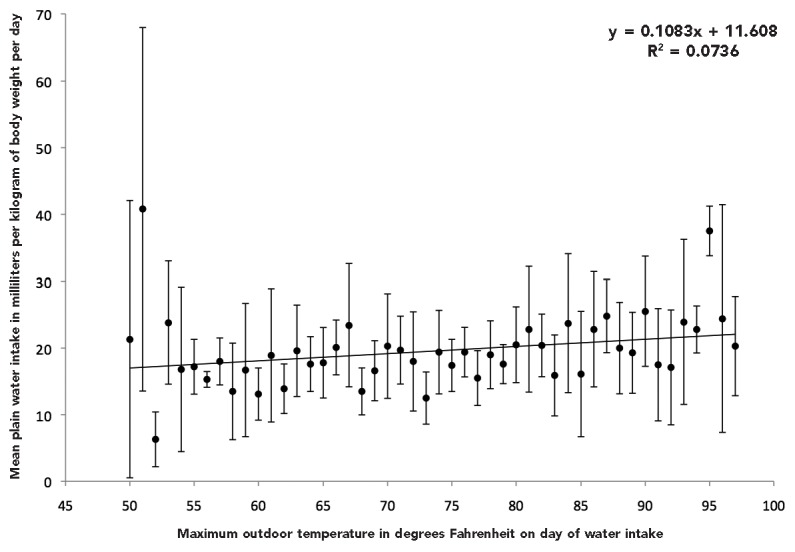
Figure 2.
Mean plain water intake among children aged 1–10 years by maximum outdoor temperature on day of reported water intake: United States, 1999–2004a,b

aA linear regression line through the points can be described by the equation y 5 11.608 + 0.1083x, where y is total water intake and x is temperature. The R-squared value is 0.0736. The p-value for the coefficient for temperature is p=0.06. On days with high temperatures <54°F or >94°F, a few points for mean plain water intake are further from the regression line than the points for mean plain water intake on days with high temperatures from 54°F–94°F. Together, this information suggests that outdoor temperature explains little of the variability in plain water intake.
bChildren aged 1–10 years on date of the National Health and Nutrition Examination Survey examination with data for outdoor temperature in county of residence and water intake data from the 24-hour dietary interview
