
Figure.
Drug overdose death ratesa, by jurisdiction: United States and selected states, 2010b
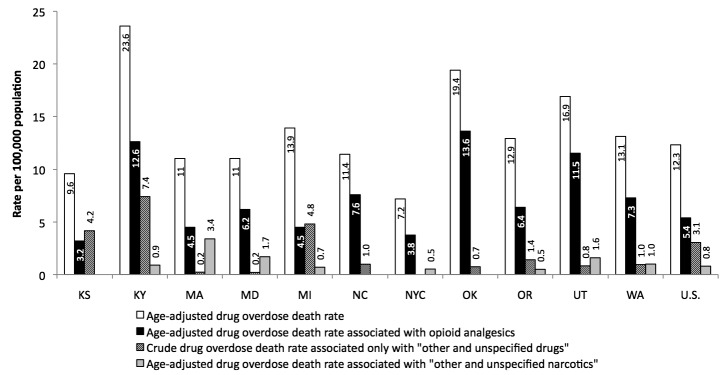
aPer the National Center for Health Statistics reporting rules, the following rates were suppressed (based on fewer than 10 deaths): the New York City overdose death rate associated only with “other and unspecified drugs” and the Kansas and Oklahoma overdose death rates associated with “other and unspecified narcotics”. The North Carolina overdose death rate associated with “other and unspecified narcotics” was unreliable (based on fewer than 20 deaths). Both the suppressed and unreliable rates were omitted from the figure.
bSource: Centers for Disease Control and Prevention (US). CDC WONDER: multiple cause of death data [cited 2015 Jan 16]. Available from: URL: http://wonder.cdc.gov/mcd.html