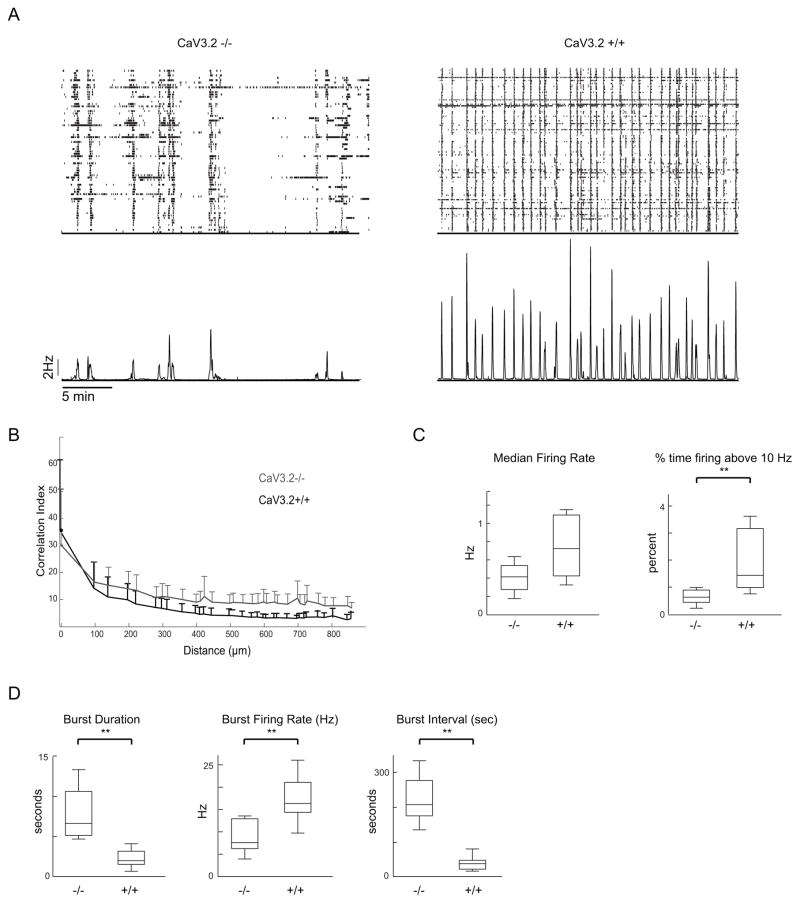
Figure 1. Temporal pattern of spontaneous retinal waves is altered in CaV 3.2 KO mice.
A. TOP - Raster plot of single-unit spike trains from retinal ganglion cells recorded over a 60-minute period from P11 CaV3.2 KO (left) and CaV3.2 +/+ (right) retina. BOTTOM – Average firing rate of all units.
B. Pairwise correlation index as a function of intercellular distance for CaV3.2 KO (grey) and CaV3.2+/+ (black) retinae (averaged across all retinas per genotype). The data points correspond Data points correspond to mean values of medians from individual datasets and error bars represent s.e.m. The bottom error bars have been omitted for clarity.
C/D. Summary of the temporal properties of spontaneous firing patterns for CaV3.2 KO and CaV3.2 +/+ retinae. We computer properties for all action potentials (C) and separately for bursts (D). Data are averaged over mean values for each cell of a given genotype.

