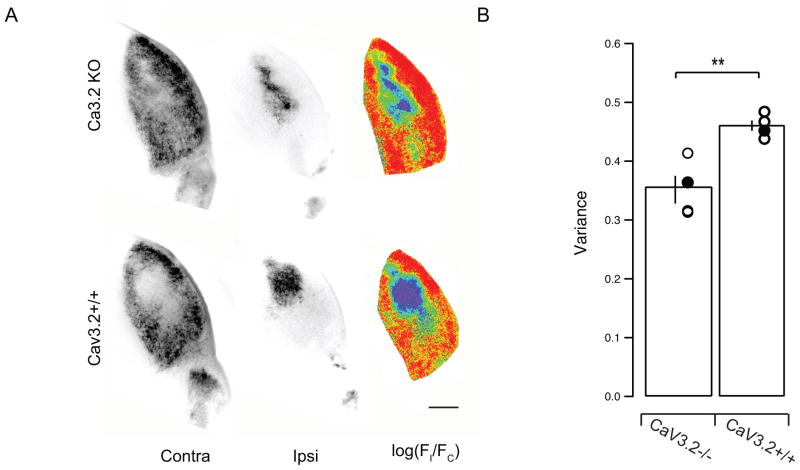
Figure 2. CaV3.2 KO mice have reduced eye-specific segregation.
A, Fluorescence images of dLGN sections in CaV3.2KO (top) and CaV3.2+/+ (bottom) mice. Left, Fluorescence of Alexa 488-labeled, contralateral-projecting retinogeniculate axons; middle, fluorescence of Alexa 594-labeled, ipsilateral-projecting retinogeniculate axons; right, pseudo-color images based on the logarithm of the intensity ratio (r =log(FI/FC)) for each pixel. Scale bar, 200 μm.
B. Summary of the variance of the distribution of the R values for all the pixels in the images in each brain. The broader the distribution of R-values is for a given dLGN, the greater the extent of segregation.

