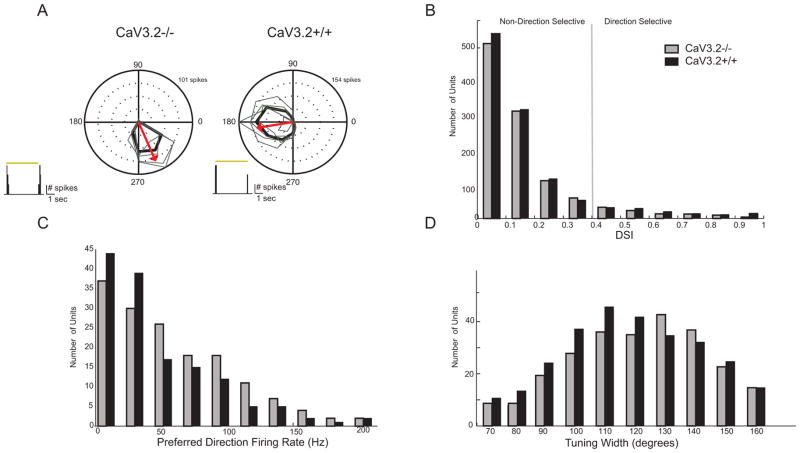
Figure 3. CaV3.2 KO mice have distribution of directional responses that are indistinguishable from control.
A. Polar plot of mean spike rate response to motion in 12 directions across five repetitions from CaV3.2 KO and CaV3.2+/+ retinae. The tuning curve was obtained using the mean firing rate in response to each direction. The arrow indicates mean preferred direction of the example cell.
B. Summary distribution for direction selectivity index (DSI) from all CaV3.2 KO and CaV3.2+/+ units.
C. Summary distribution for maximum firing rate in the preferred direction.
D. Summary distribution of tuning widths as based on fitting tuning curves to a von Misses distribution (see Methods).

