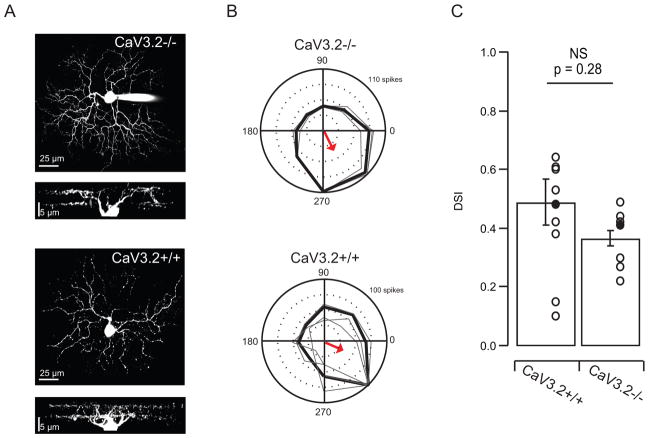
Figure 4. Targeted cell-attached recordings from identified On-Off DSGCs have similar tuning in CaV3.2 KO and CaV3.2+/+ mice.
A. Maximal intensity projections of z-stack images of two ON-OFF DSGCs (filled with Alexa Fluor 488) and side views of the complete dendritic arborizations showing dendritic arbors in the on and off sublaminae from CaV3.2−/− and CaV3.2+/+ mouse.
B. Targeted 2-photon recordings of light responses from GFP+ cells in transgenic mice in which GFP is expressed in subtype of DSGCs. Polar plots of mean spike rate response to motion in 8 directions across three repetitions from CaV3.2−/− (top) and CaV3.2+/+ (bottom) retinae. The tuning curve was obtained using the mean firing rate in response to each direction. The radius scale is the normalization of the spike-count in each direction. The maximum response is the spike-count in the preferred direction, and it is written in the top right corner of the polar plots. The arrow indicates mean preferred direction of the example cell.
D. Summary data comparing DSIs in CaV3.2+/+ and CaV3.2−/−.

