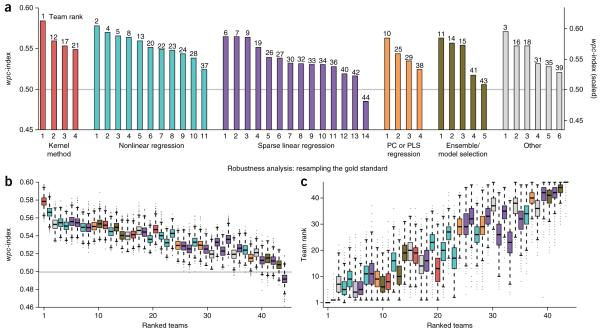
Figure 2.
Evaluation of individual drug sensitivity prediction algorithms. Prediction algorithms (n = 44) are indexed according to Table 1. (a) Team performance was evaluated using the weighted, probabilistic concordance index (wpc-index), which accounts for the experimental variation measured across cell lines and between compounds. Overall team ranks are listed on top of each bar. The gray line represents the mean random prediction score. (b,c) Robustness analysis was performed by randomly masking 10% of the test data set for 10,000 iterations. Performing this procedure repeatedly generates a distribution of wpc-index scores for each team (b). Additionally, after each iteration, teams were re-ranked to create a distribution of rank orders (c). The top two teams were reliably ranked the best and second-best performers (one-sided, Wilcoxon signed-rank test for b and c, FDR « 10−10).

