Fig. 14.

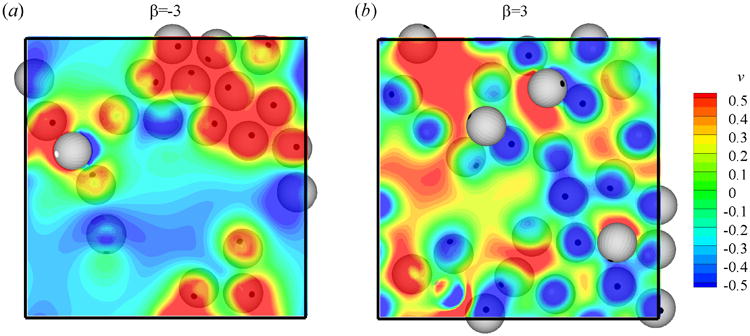
(Color online) Top view of the flow field near the bottom wall of a suspension of (a) pushers (β = −3) and (b) pullers (β = 3). Contourplots show the distribution of velocity component v on the plane of y = 2.5.

(Color online) Top view of the flow field near the bottom wall of a suspension of (a) pushers (β = −3) and (b) pullers (β = 3). Contourplots show the distribution of velocity component v on the plane of y = 2.5.