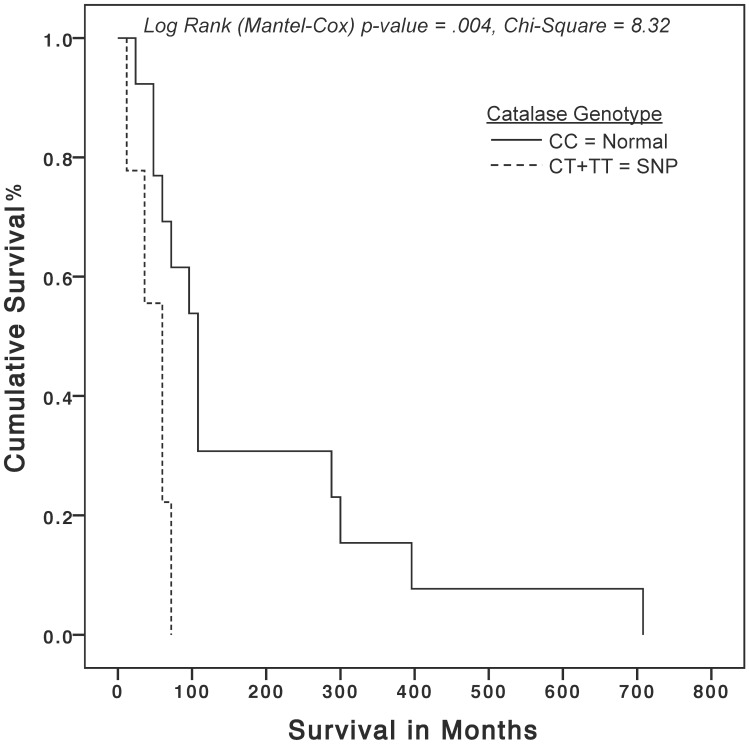
Fig 1. Kaplan-Meier overall survival curves for in ovarian cancer utilizing a specific catalase SNP.
The solid curve represents cases with (CC) homozygous wild-type genotype as compared to the dashed curve, which represents cases with homozygous mutant plus heterozygous mutant (CT+TT) genotypes. The X-axis represents patient survival in months; the Y-axis represents cumulative survival percentage. Chi-square p-value 0<0.05 is considered statistically significant.

