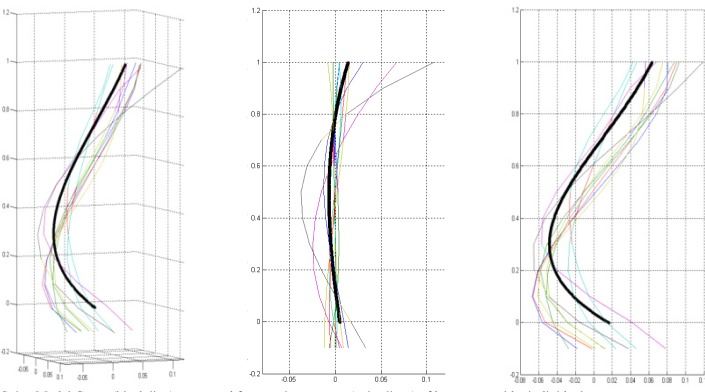
Fig 4. Spine Model Curve.
Spine Model Curve (black line) is composed from various curves (colored lines) of healthy individuals shown in 3 different views: a 3D view (left), coronal plane (center), and the sagittal plane (right). As described, the coordinates are scaled by the vertical distance between the superior end plate of the sacrum and the inferior end plate of T12.

