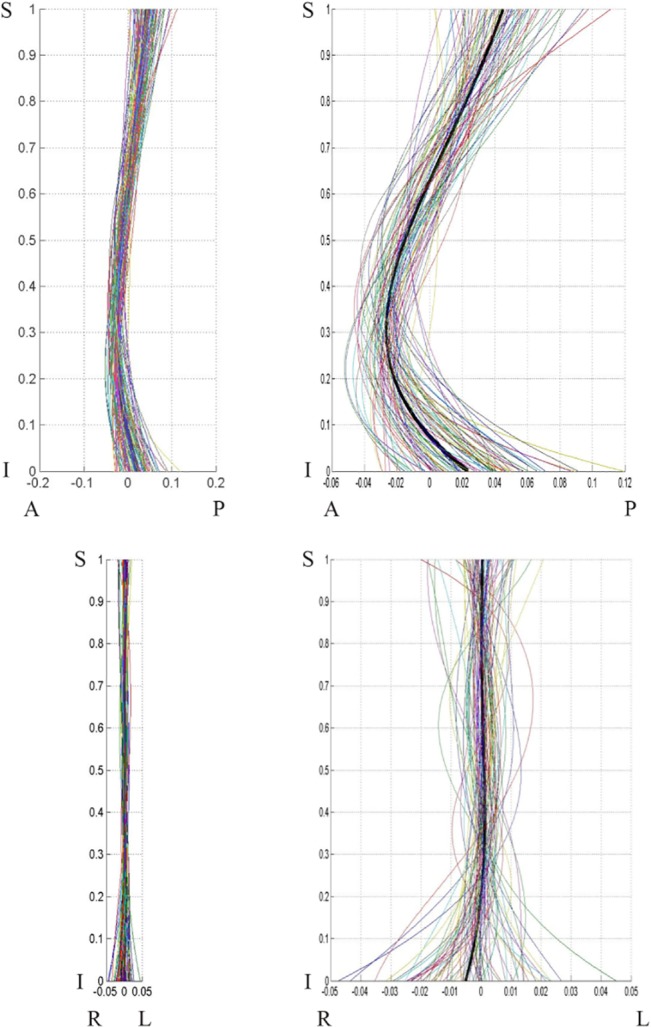
Fig 6. Males population curve 2-D view.

Male population curve 2-D views: sagittal (top) and coronal (bottom) planes. The coordinates are scaled by the vertical distance between the superior end plate of the sacrum and the inferior end plate of T12.

Male population curve 2-D views: sagittal (top) and coronal (bottom) planes. The coordinates are scaled by the vertical distance between the superior end plate of the sacrum and the inferior end plate of T12.