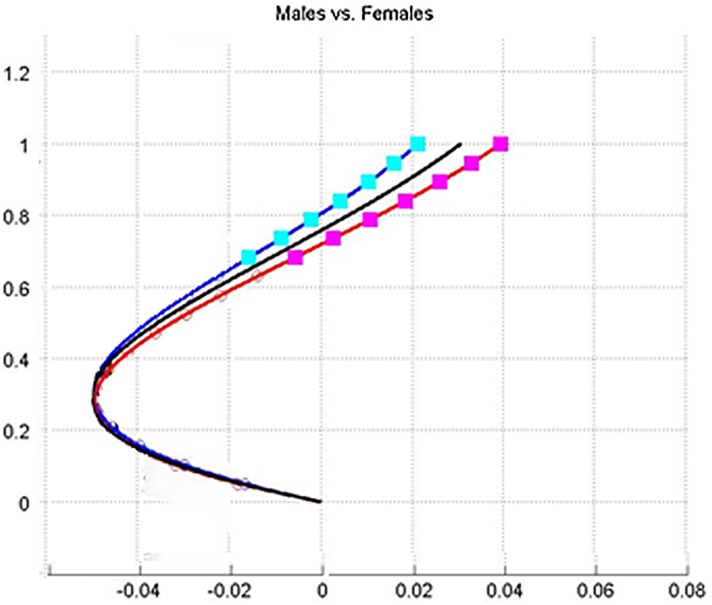
Fig 9. Models of male population vs. female population.
Graphical comparison of the sagittal plane of the curve shape between male and female populations: black line—general population; blue line—male population; red line—female population. Squares denote locations of significant differences (p < 0.05) between the curves. The graph is scaled to arbitrary proportions for a better view of curve differences.

