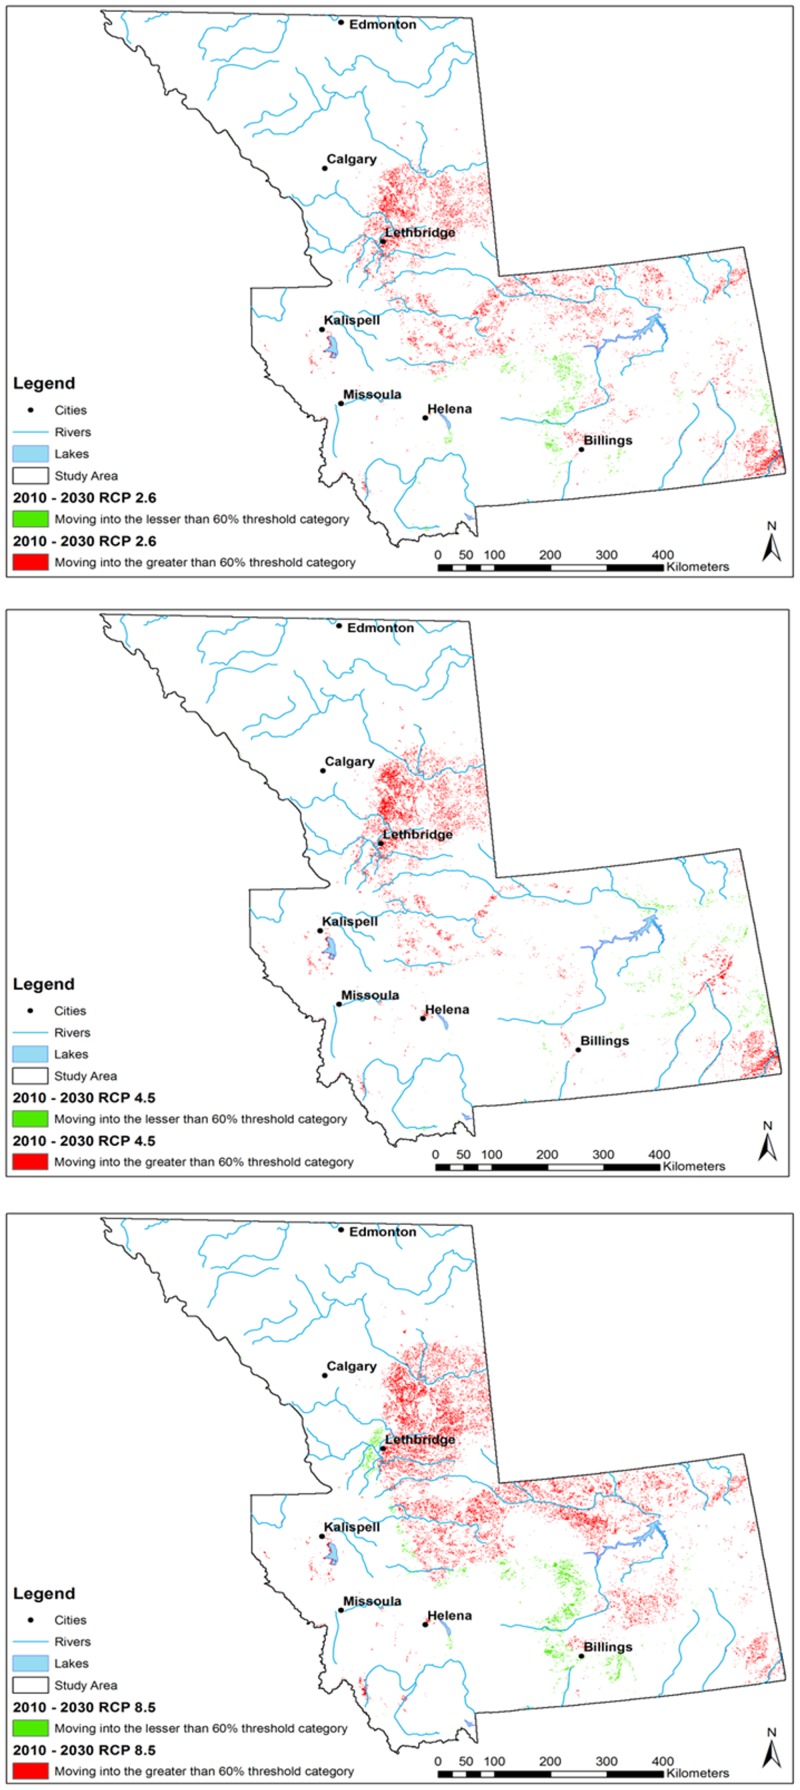
Fig 5. Maps of pixel change into and out of 0.6 threshold category (expressed as percentage) for Culicoides sonorensis occurrence probability as predicted with the Maximum Entropy algorithm under different climate change scenarios (Representative Concentration Pathways, RCP) projected for 2010–2030.
Each RCP is displayed (A) RCP 2.6; (B) RCP 4.5; (C) RCP 8.5. Green represents those areas moving into lesser than 0.6 probability threshold category (expressed as percentage; 60%), red represents those areas moving into the greater than 60% probability threshold category for Culicoides sonorensis occurrence.

