
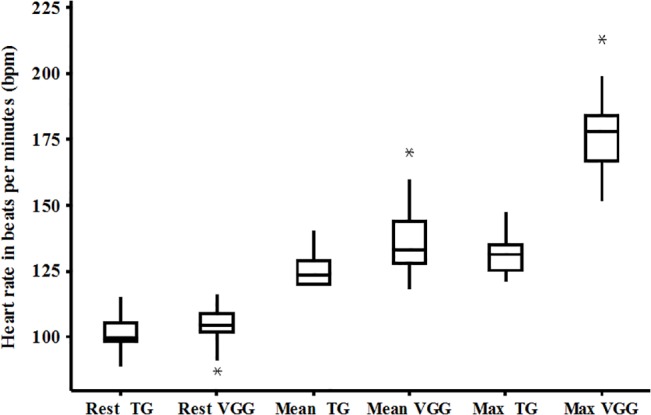
Fig 2. Heart rate response during training for both groups; the data presented in the box plot and boxes represent the 25th-75th percentiles; the lines inside the boxes represent the medians and the bars represent the 10th and 90th percentiles.
Official websites use .gov
A
.gov website belongs to an official
government organization in the United States.
Secure .gov websites use HTTPS
A lock (
) or https:// means you've safely
connected to the .gov website. Share sensitive
information only on official, secure websites.