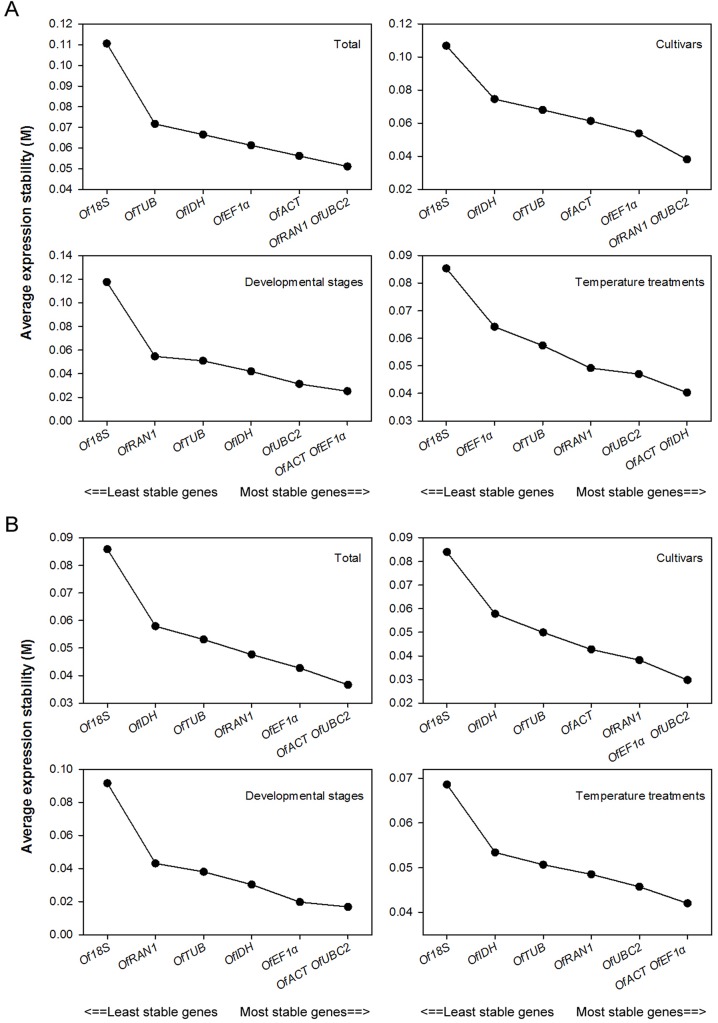
Fig 2. Expressional stability values (M) of seven candidate reference genes in four sample sets using SYBR Green (A) or EvaGreen (B) generated by the geNorm software.
Average expressional stability values (M) following stepwise exclusion of the least stable gene across all experimental sets. The least stable genes are on the left, and the most stable genes are on the right.

