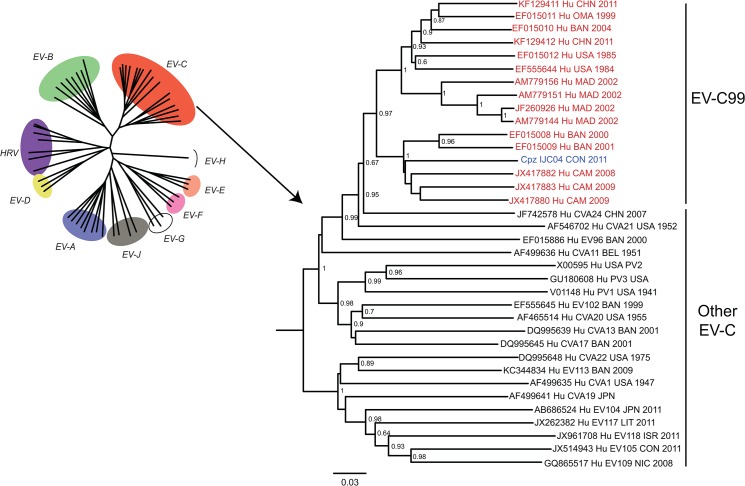
Fig 1. Phylogenetic tree constructed using the entire VP1 sequences (approximately 900 bp) of all EV-C serotypes.
Study sample is indicated in blue (IJC04) and EV-C99 serotype sequences in red. Accession numbers and information concerning the date of collection and the host species (Hu for human and Cpz for Chimpanzee) are shown. The bootstrap values correspond to 10,000 replicates. Only values above 0.6 are indicated at the nodes. The scale bar represents nucleotide substitutions per site.

