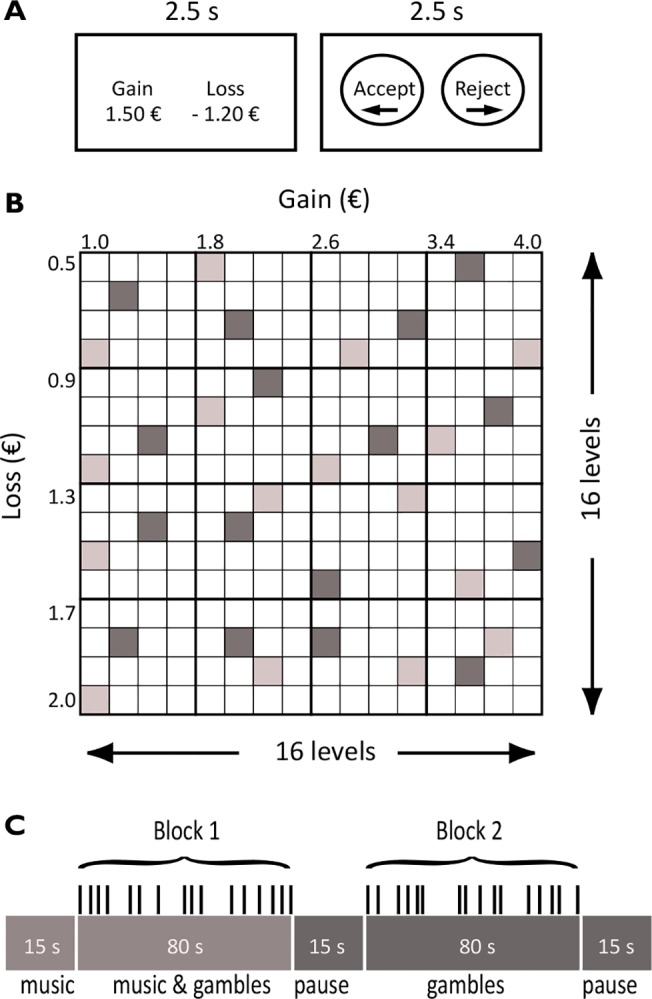
Fig 2. The financial decision making task.

(A) Exemplary computer screen plot from the experiment. The task of the subjects was to accept or reject gambles that offered a 50–50 chance of gaining or losing money. Gains ranged from 1 to 4 euros and losses from 0.5 to 2 euros. (B) The payoff matrix comprised 256 different gambles. The 256 gambles were divided into 16 sets of 16 gambles each. Within a set, the 16 gambles were scattered around the payoff matrix such that only one gamble came from each of the separate 4 by 4 areas in the matrix. The two different shades of grey rectangles in the figure represent two examples of a set of gambles. (C) Subjects played 16 different blocks, 16 gambles in each block, and a block with music was always followed by a block without music. To keep subjects’ attention high and to avoid unreflected automatic response we varied the length of the interval between the gambles (from 0.5 to 3.5 seconds).
