
Fig 3. Risk attitude and mean acceptance rates.
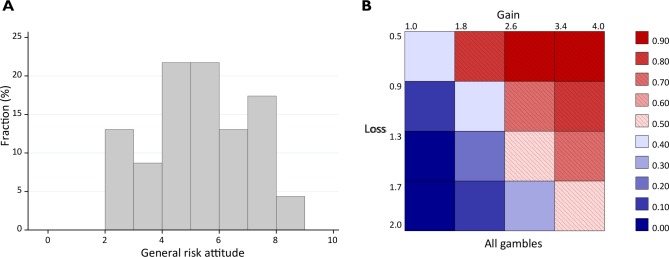
(A) The distribution of risk attitude; 0 = not willing to take risk, 10 = completely willing to take risk. The average willingness to take risk was 5.07 (SD = 1.92). (B) Payoff matrix and mean acceptance rates, all gambles.